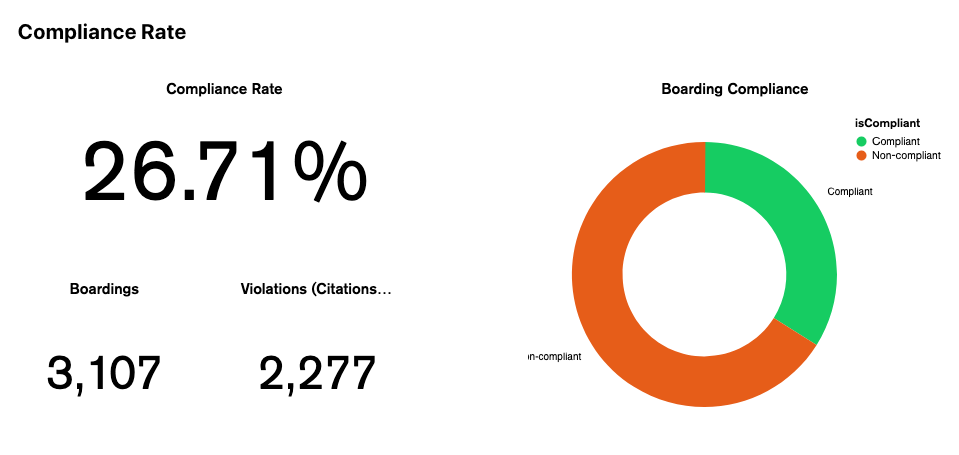
On this page, you will make the Compliance Rate chart - shown as the percentage below:
-
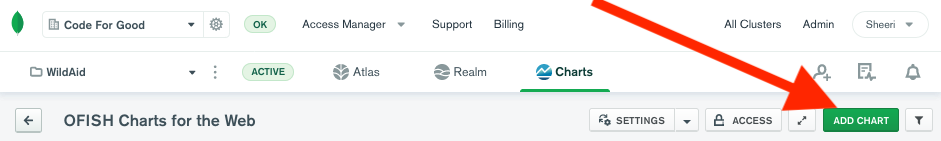
On the Charts Dashboard, select “Add Chart”
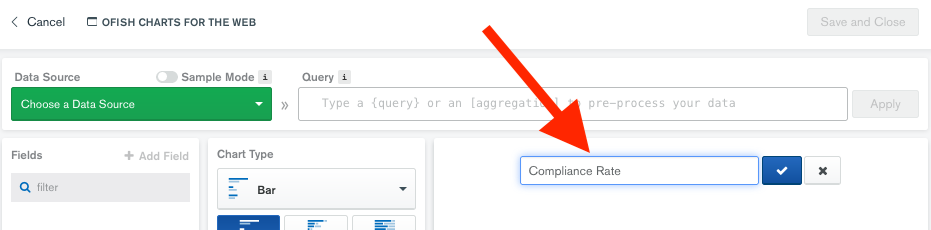
- Set the title to “Compliance Rate”
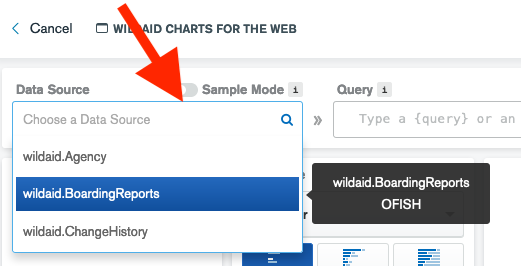
- Set the Data Source to wildaid.BoardingReports
-
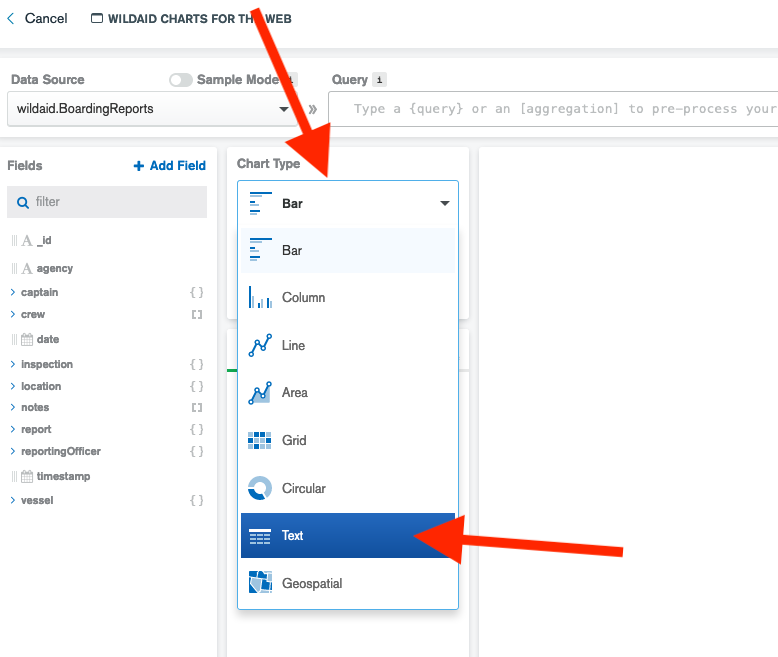
Choose a Chart type of Text:
-
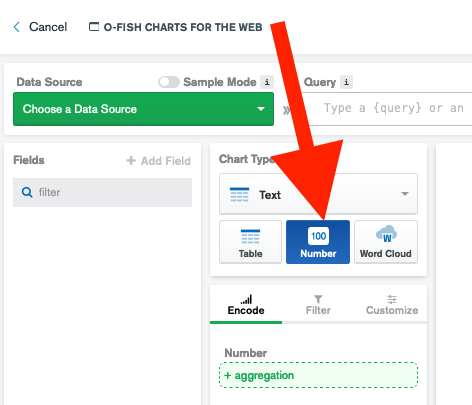
Choose a Chart subtype of Number:
- We need to calculate the percentage of a subset of data as compared to the total amount of data, which we cannot do with a calculated field. However, we can do this with an aggregation, which we can paste into the Query field, and then select “Apply”:
[{$group: { _id: null, total: { $sum: 1 },
   justCompliant: { $sum: { $cond: {
      'if': {$and: [
         {$ifNull: ['$inspection.summary.violations.disposition',0]},
         {$or: [
         {$in: ['Warning','$inspection.summary.violations.disposition']},
         {$in: ['Citation','$inspection.summary.violations.disposition']}
      ] } ] },
      'then': 0, 'else': 1
   } } }
}}, {$project: {
   percentage: { $divide: [ '$justCompliant', '$total' ] },
   inspection: 1, justCompliant: 1, total: 1
}}]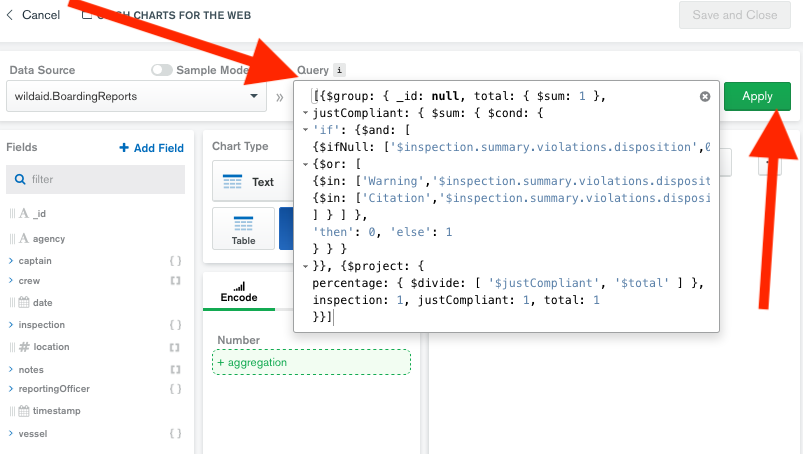
-
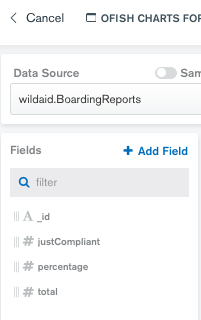
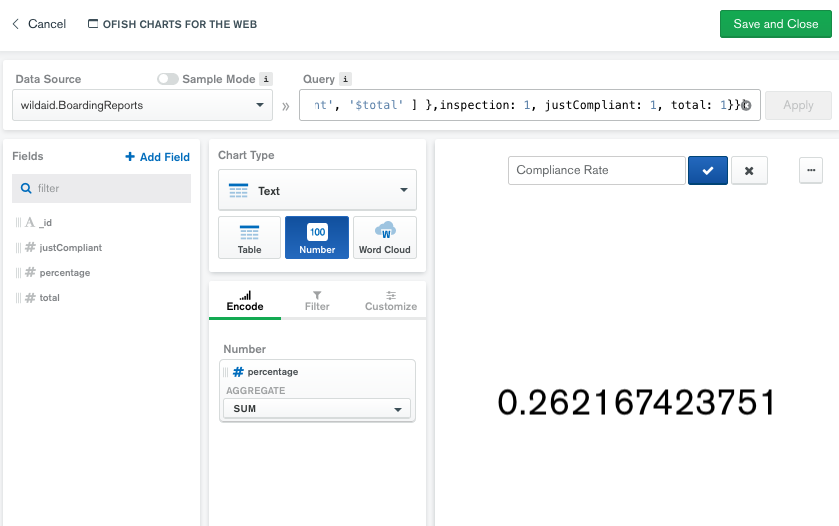
You will see your fields have changed to an ID and three numbers - justCompliant, percentage, and total:
-
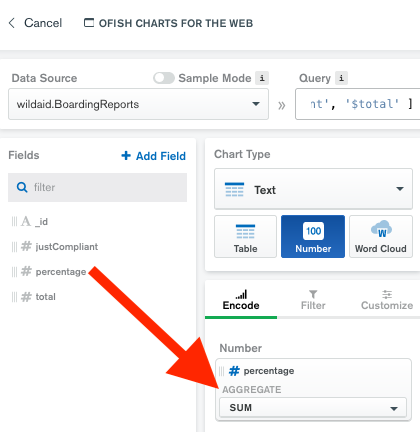
Drag “percentage” to the “Number” field, making sure that the aggregate is by “SUM”:
-
The field is in decimal value:
-
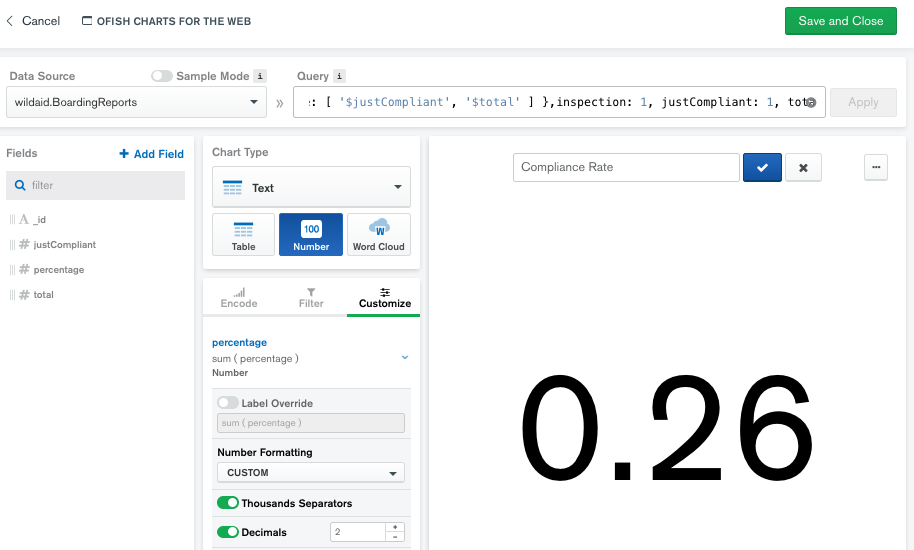
Select “Customize”, then percentage, then toggle Decimals and set it to 2:
-
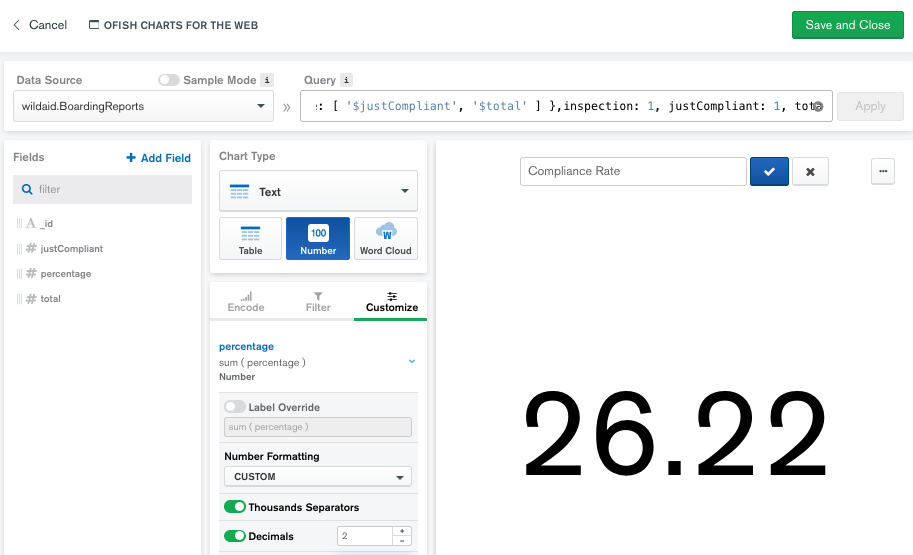
Toggle the Multiplier and set it to 100.
-
Toggle the Suffix and set it to be %:
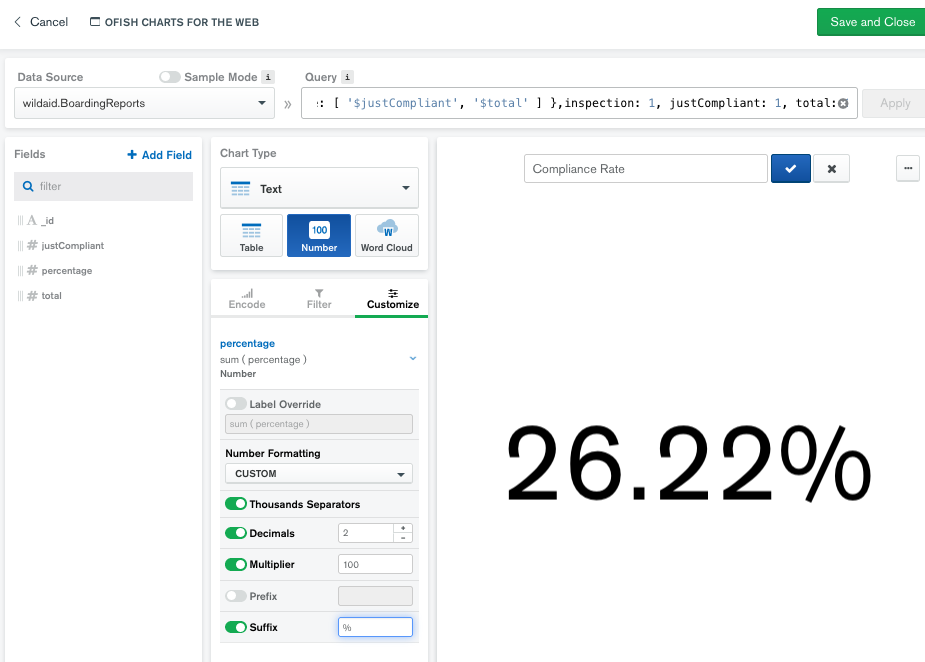
And you should see the percentage in the window. Select “Save and Close”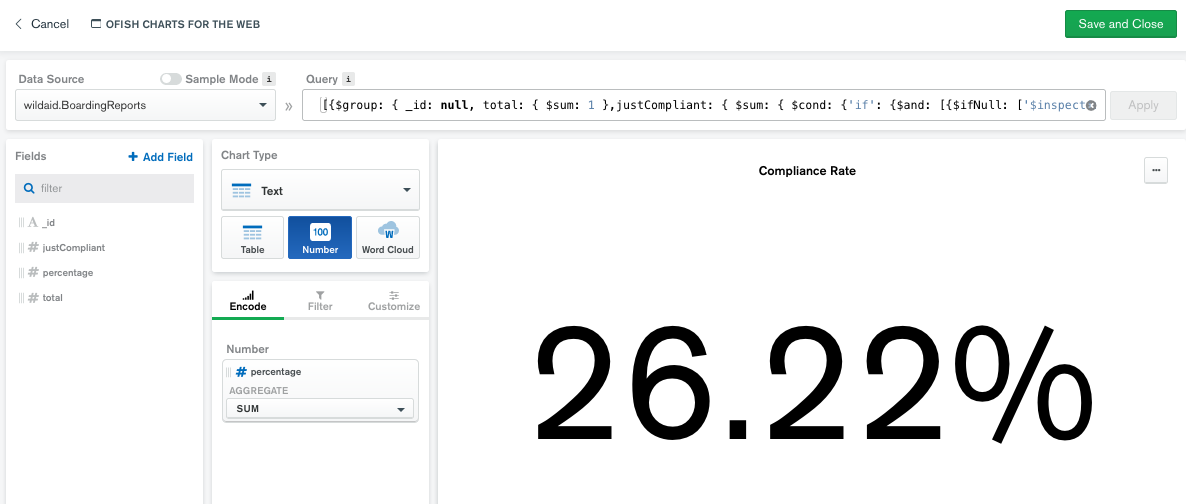
-
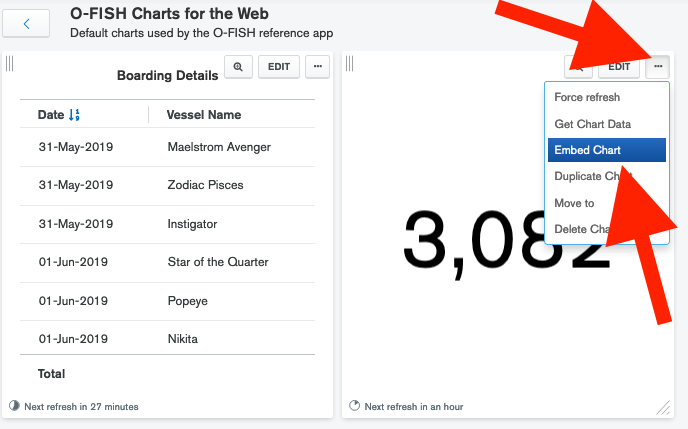
On your dashboard, mouse over the chart until you see the ellipses. Select the ellipses and select “Embed Chart”:
-
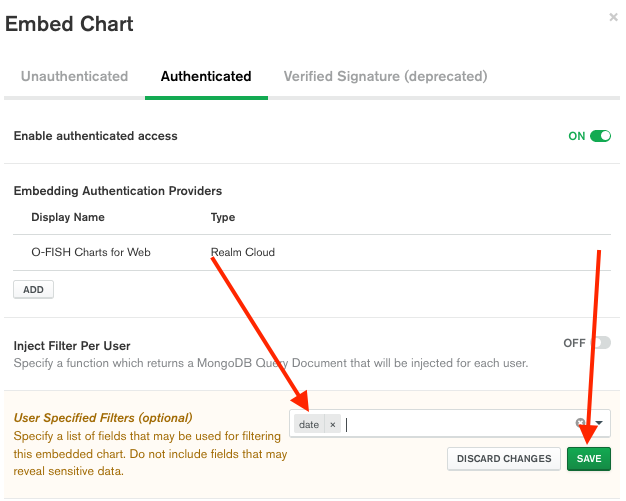
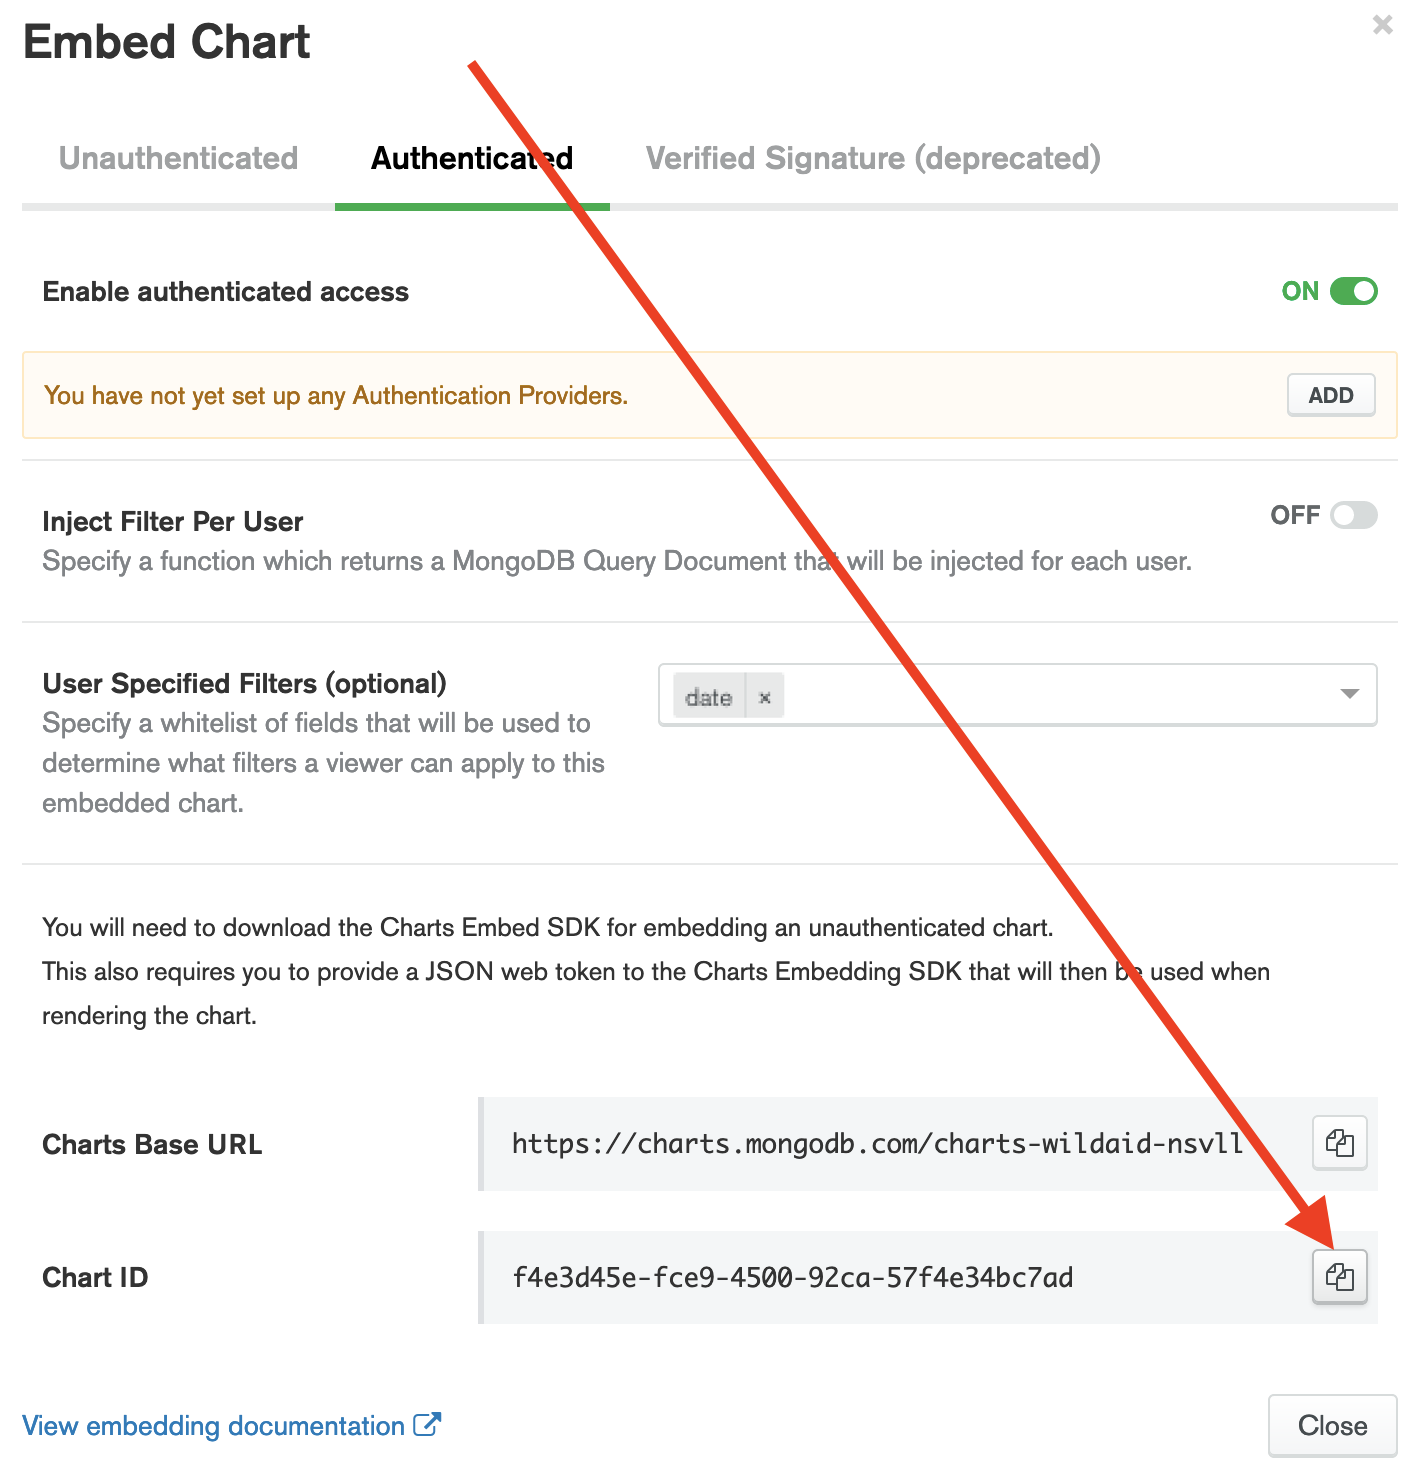
Select the “Authenticated” section, make sure “Enabled authenticated access” is set to “ON”, and set the User Specified Filters to “date” and select the green “SAVE” button:
-
Copy the Chart ID:
-
Select “Close” to close the “Embed Chart” window.
- Paste the Chart ID into your web application’s src/config.js file under “compliance-rate”.
Onward to the donut chart!