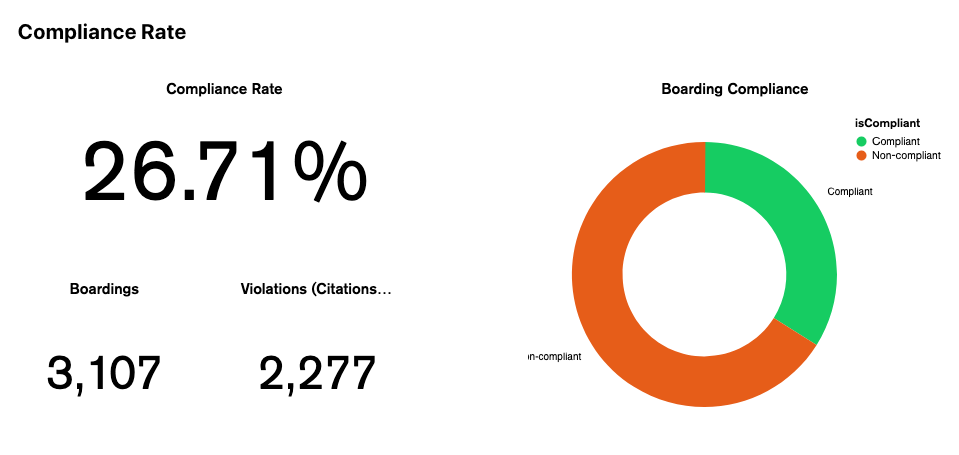
On this page, you will make two of the following Compliance Charts - specifically, the two numbers - Boardings and Violations (Citations and warnigs):
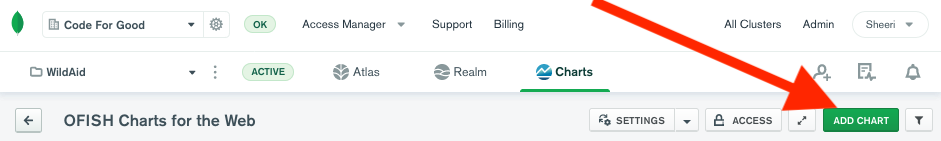
- First, let’s create the “Boardings” number. On the Charts Dashboard, select “Add Chart”
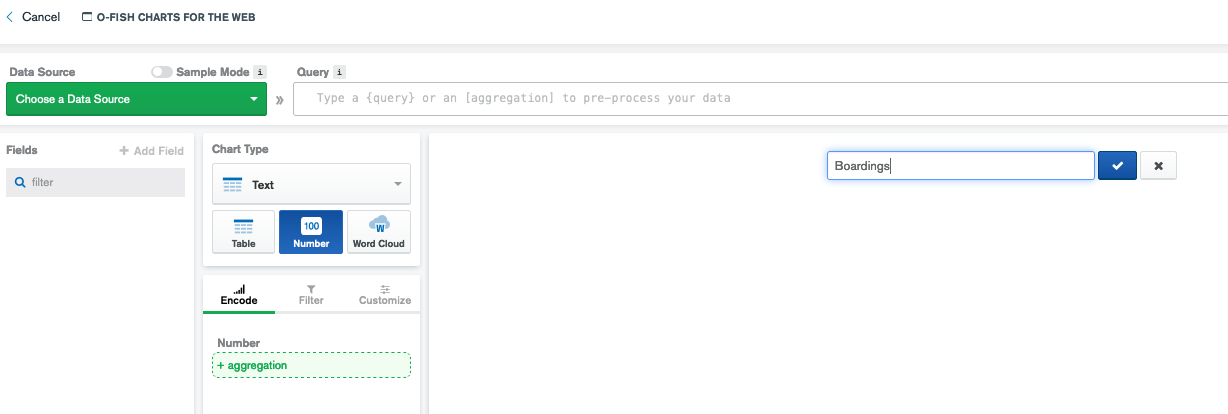
- Set the title to “Boardings”
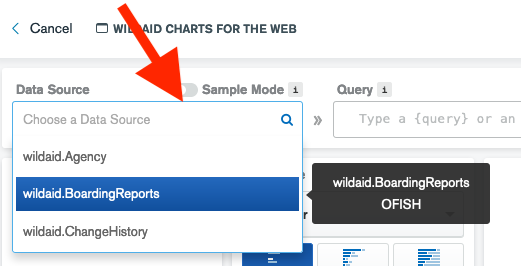
- Set the Data Source to wildaid.BoardingReports
-
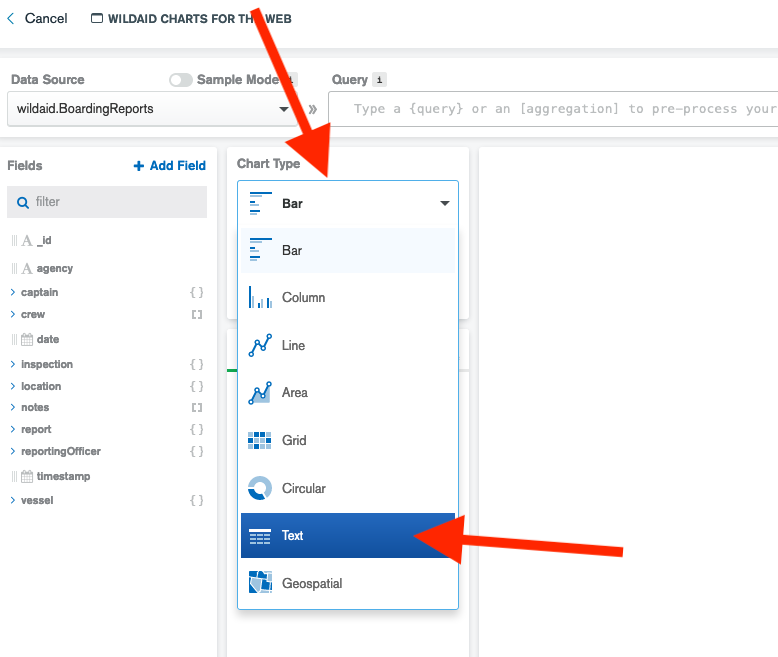
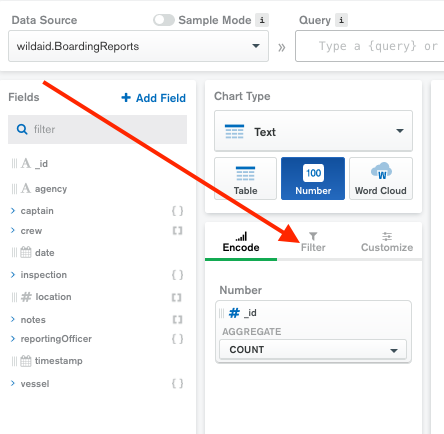
Choose a Chart type of Text:
-
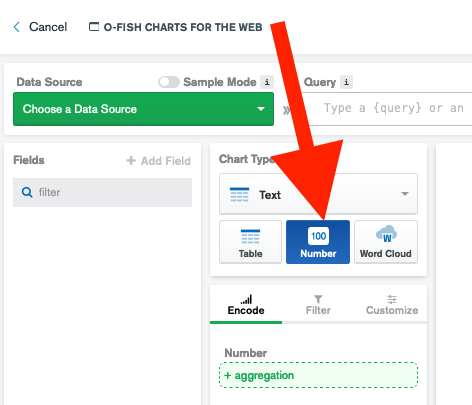
Choose a Chart subtype of Number:
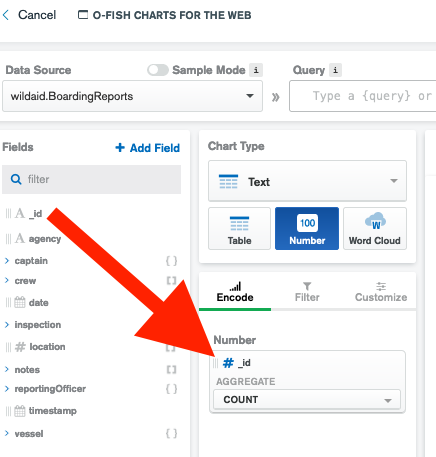
- Drag _id to the “Number” field and make sure the aggregation method is “COUNT”:
And you should see the total number of boarding reports in the window. Select “Save and Close” in the upper right. 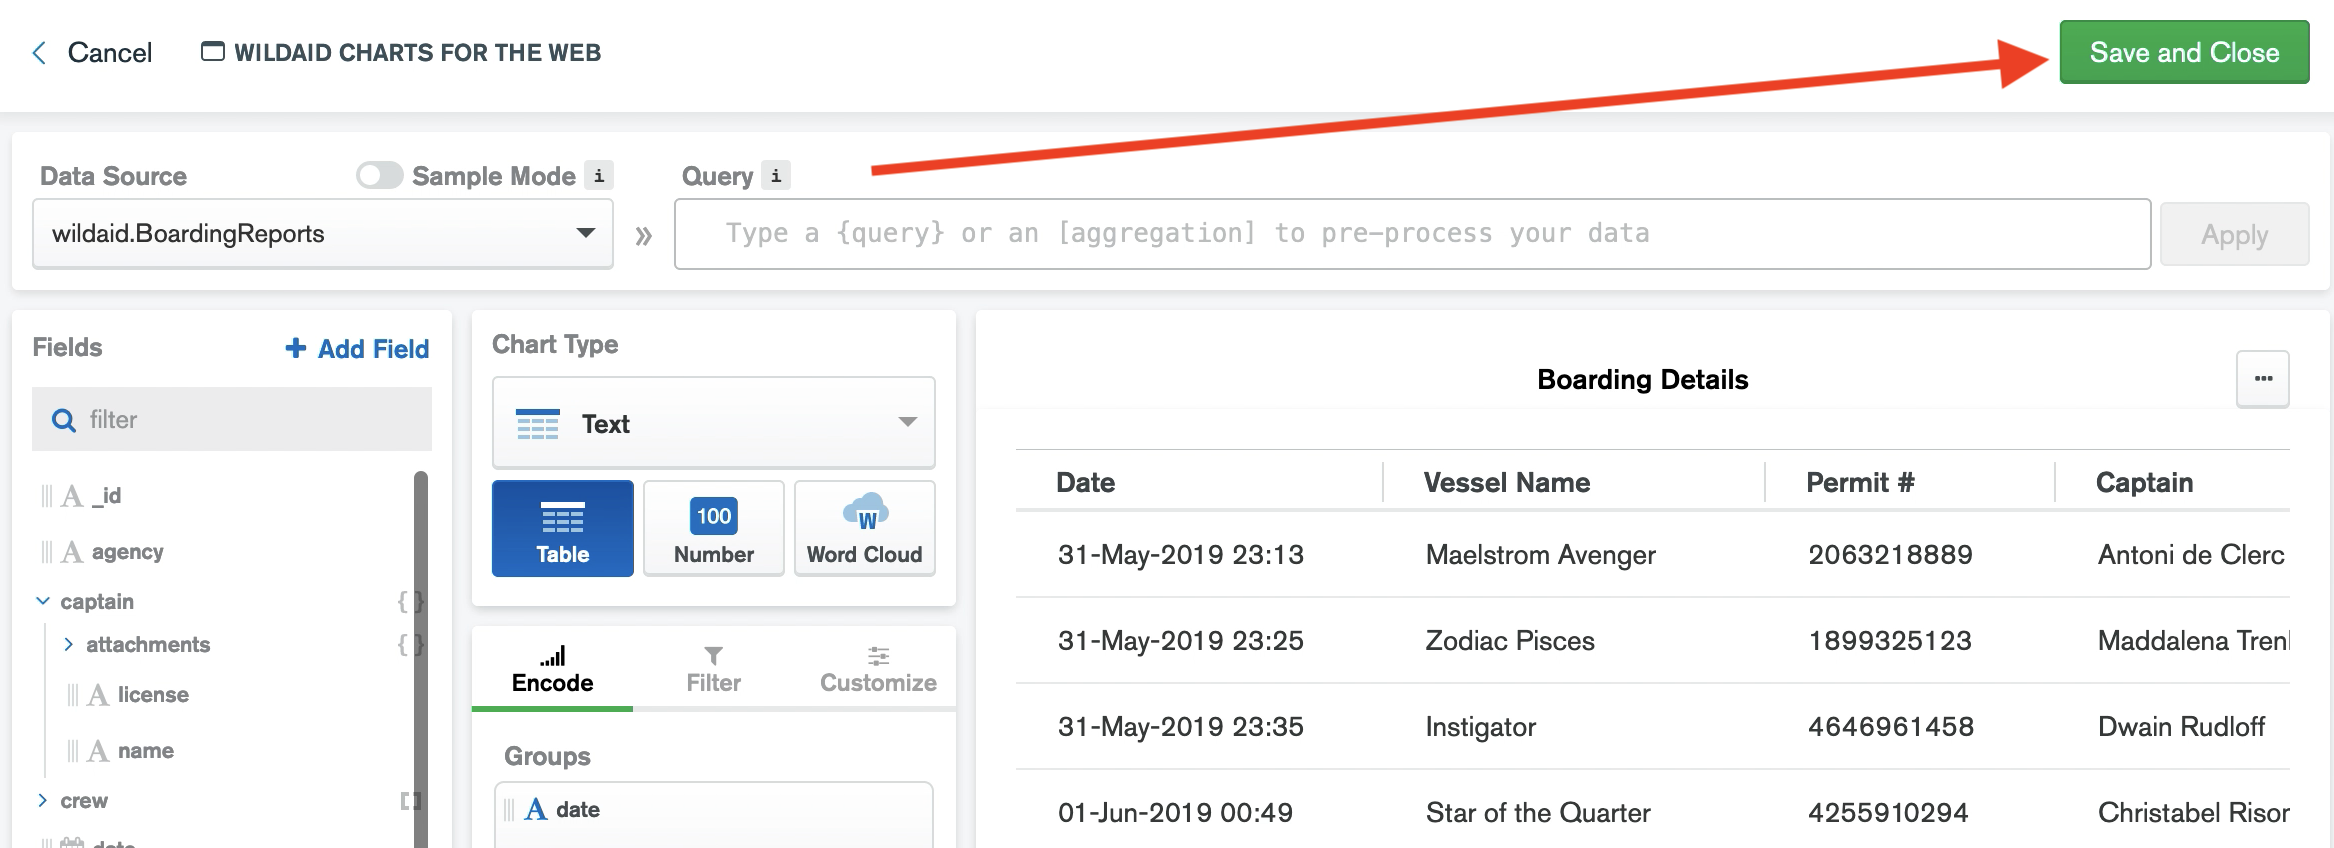
-
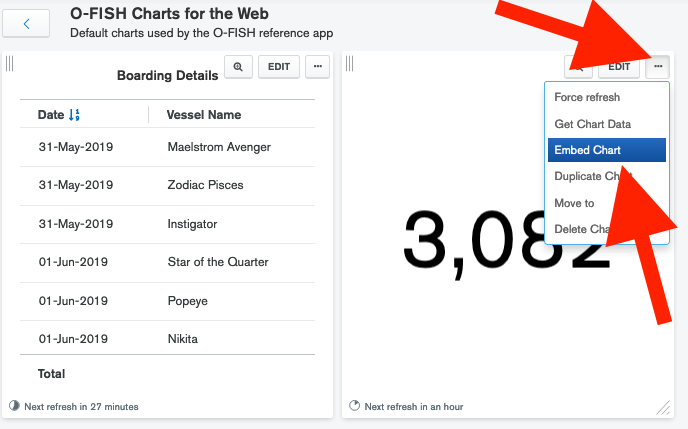
On your dashboard, mouse over the chart until you see the ellipses. Select the ellipses and select “Embed Chart”:
-
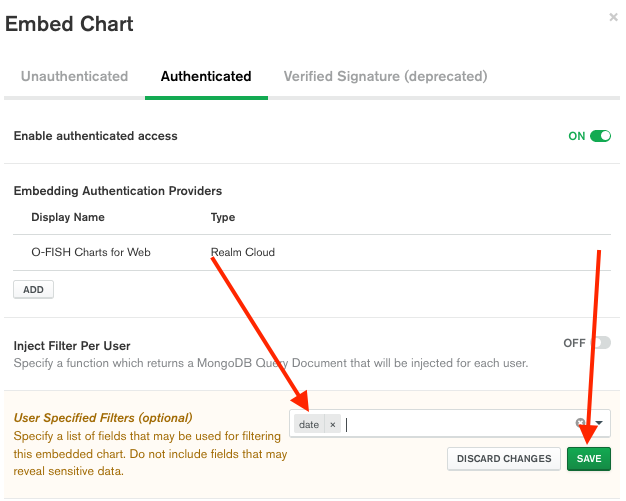
Select the “Authenticated” section, make sure “Enabled authenticated access” is set to “ON”, and set the User Specified Filters to “date” and select the green “SAVE” button:
-
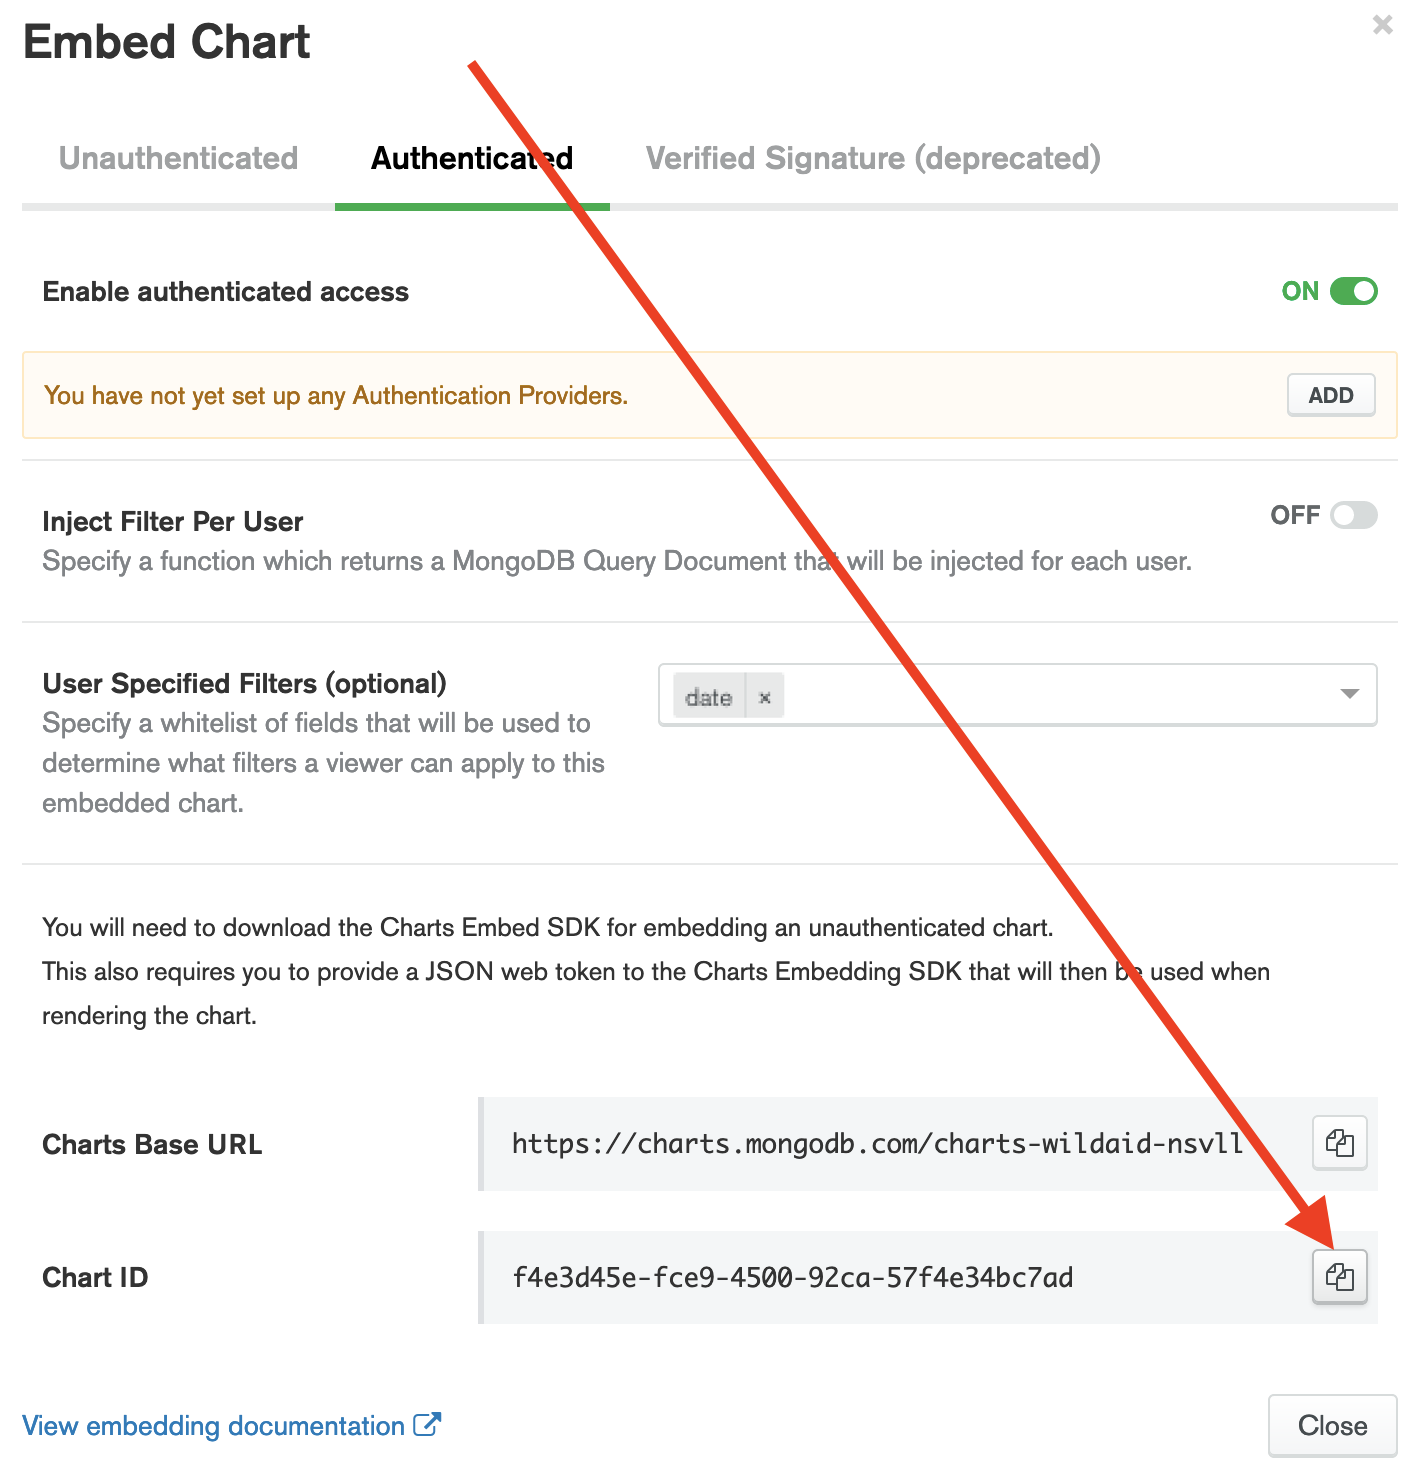
Copy the Chart ID:
-
Select “Close” to close the “Embed Chart” window.
-
Paste the Chart ID into your web application’s src/config.js file under “boardings-count-chart”.
-
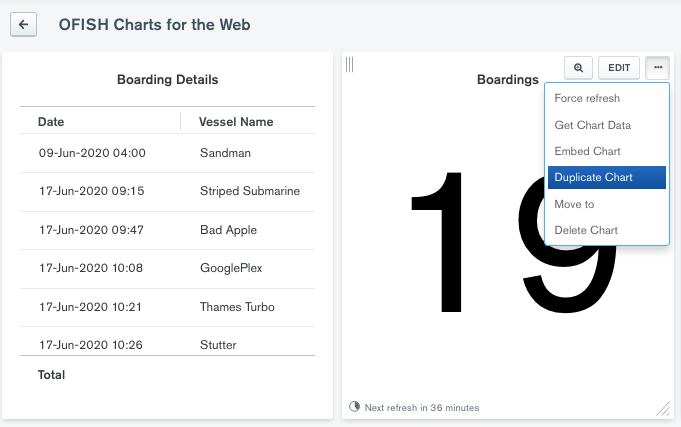
Now let’s create the “Violations” number. On the Charts Dashboard, mouse over the “Boardings” chart and select the three dots in the corner, then select “Duplicate Chart”:
-
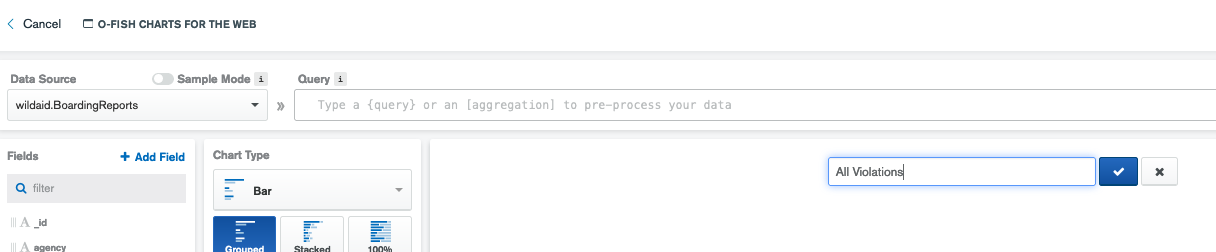
Set the title of the new, duplicated chart to “All Violations”
-
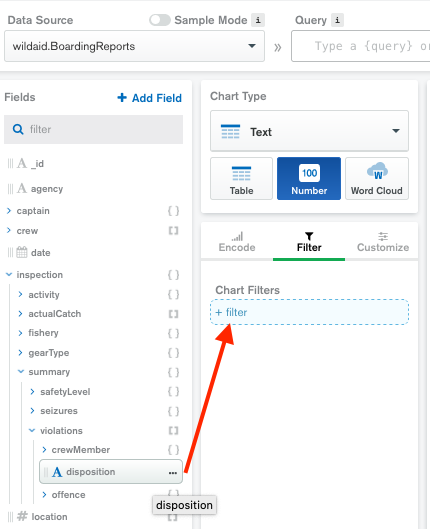
To filter for records that contain citations or warnings, select “Filter”:
Drag inspection -> summary -> violations -> disposition to “+ filter”:
Select only Citation and Warning:
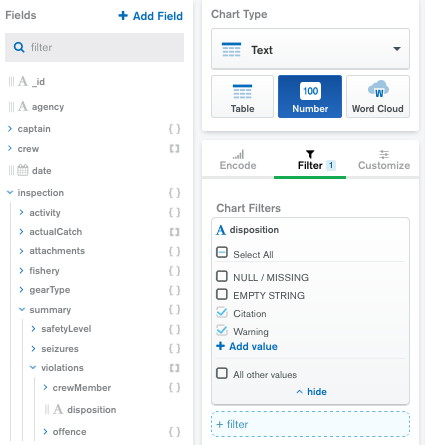
And you should see the total number of boarding reports with violations in the window. Select “Save and Close” in the upper right. -
On your dashboard, mouse over the “Violations” chart until you see the ellipses. Select the ellipses and select “Embed Chart”:
-
Select the “Authenticated” section, make sure “Enabled authenticated access” is set to “ON”, and set the User Specified Filters to “date” and select the green “SAVE” button:
-
Copy the Chart ID:
-
Select “Close” to close the “Embed Chart” window.
-
Paste the Chart ID into your web application’s src/config.js file under “citations-and-warnings”
Onward to the percentage!