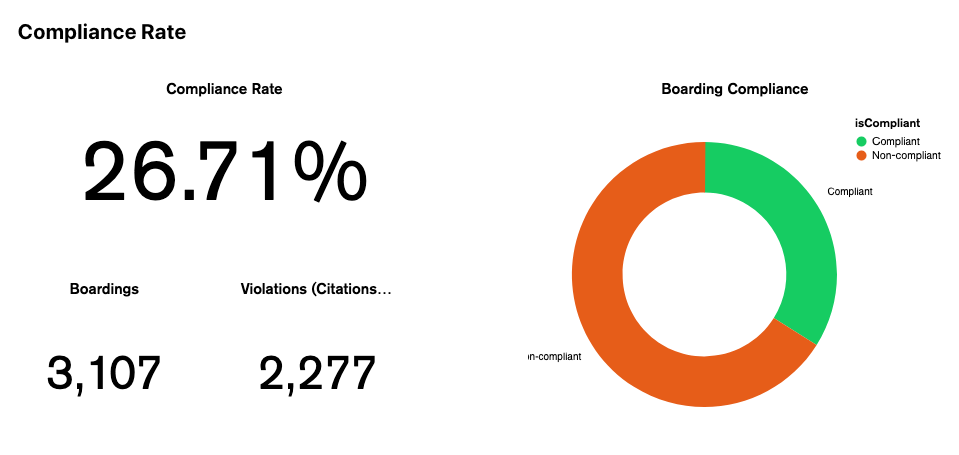
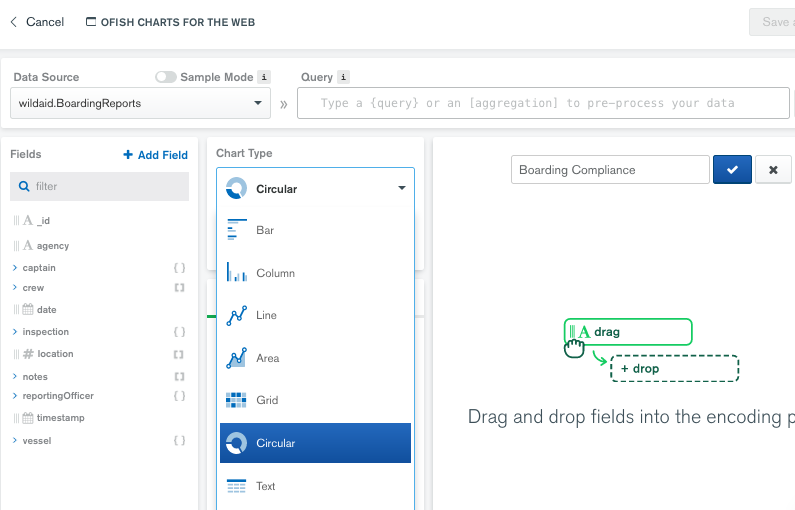
On this page, you will make the Compliance Rate donut chart shown below, on the right:
-
On the Charts Dashboard, select “Add Chart”
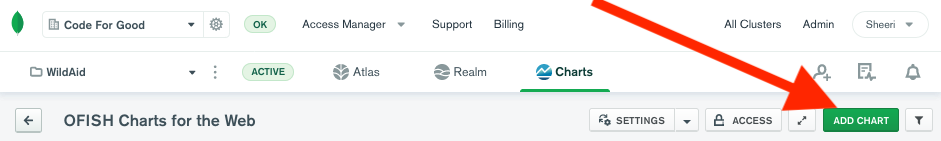
- Set the title to “Boarding Compliance”
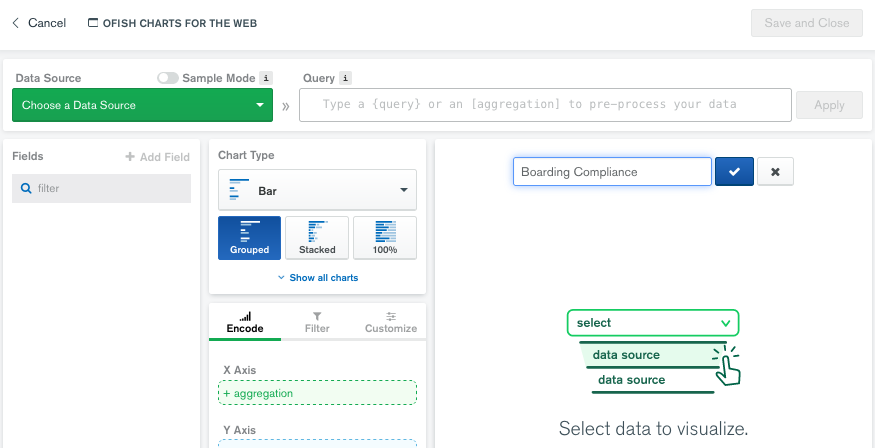
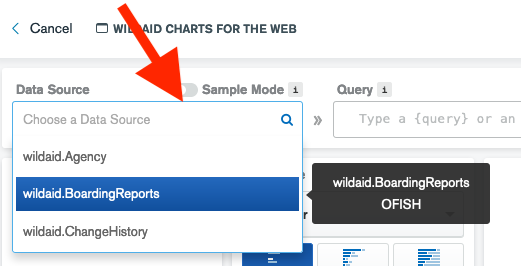
- Set the Data Source to wildaid.BoardingReports
-
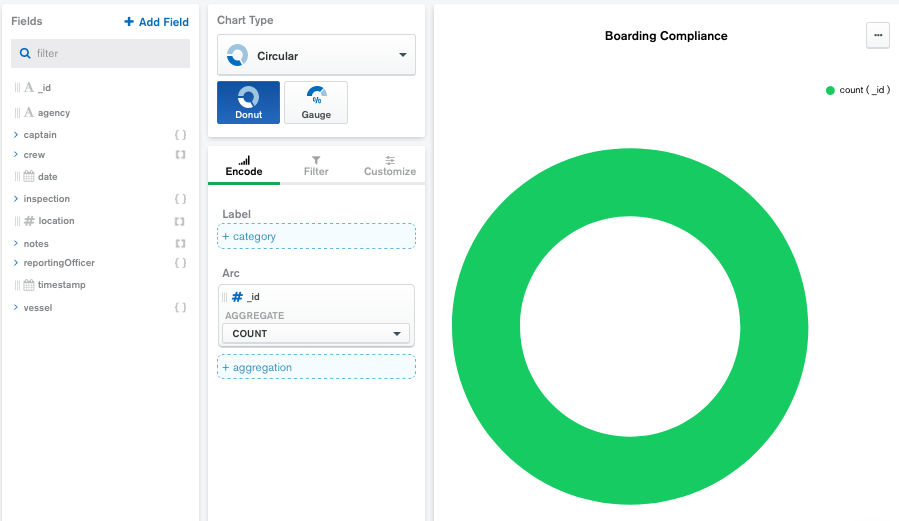
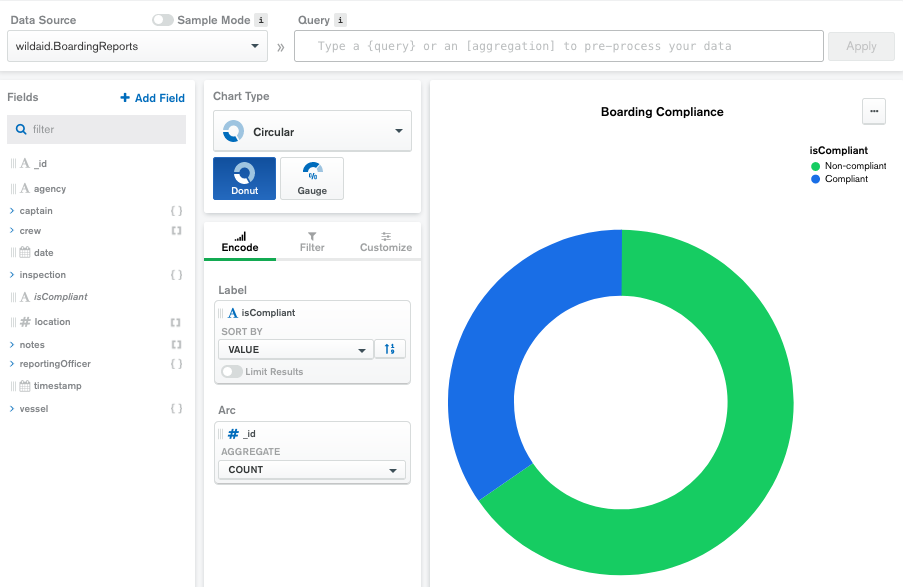
Choose a Chart type of Circular, which will the default chart subtype “Donut”:
-
Drag “_id” to the “Arc” field, making sure that the aggregate is by “COUNT”:
-
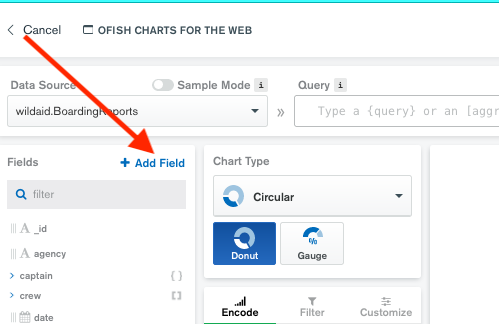
To show how many boardings are compliant vs. non-compliant, let’s create a calculated field. Select “+ Add Field”:
-
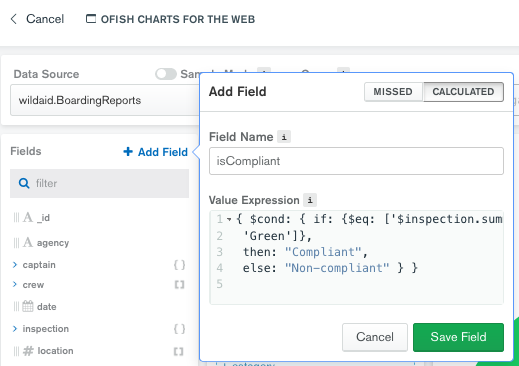
Select “CALCULATED” in the upper right of the popup box, set the Field Name to “isCompliant”, and set the Value Expression to check if the boarding is compliant or not:
{ $cond: { if: {$eq: ['$inspection.summary.safetyLevel.level','Green']},
then: "Compliant",
else: "Non-compliant" } }
and then select “Save Field”:
-
Drag the new isCompliant field to the Label, making sure the SORT BY menu is set to “VALUE”:
-
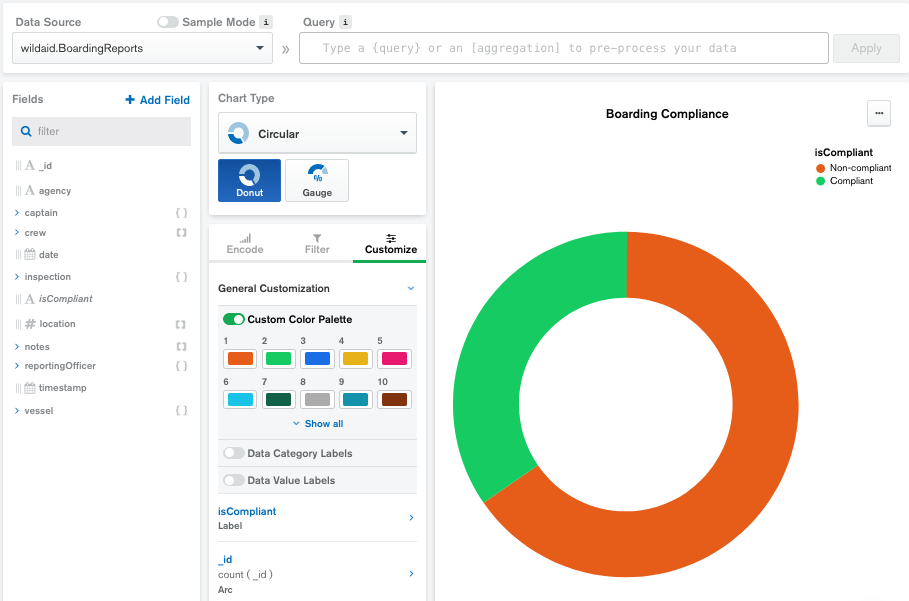
Select “Customize”, toggle “Custom Color Palatte” to be on, and drag the colors to the proper ordering so that Non-compliant is red and Compliant is green:
-
Select “Save and Close”
-
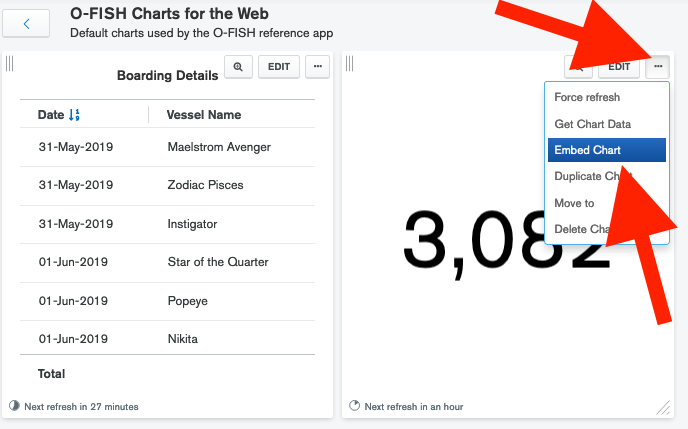
On your dashboard, mouse over the chart until you see the ellipses. Select the ellipses and select “Embed Chart”:
-
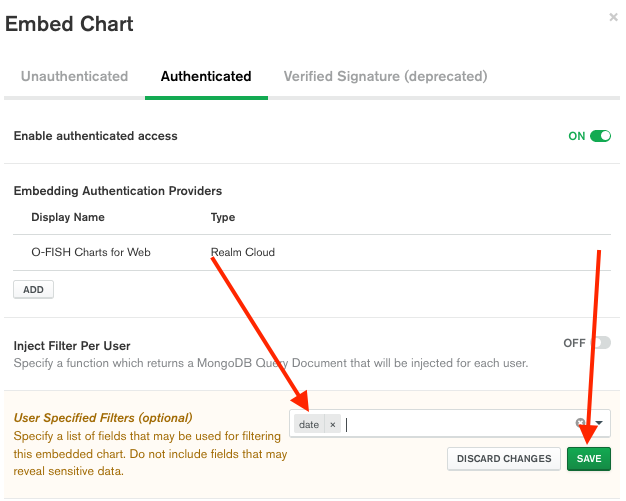
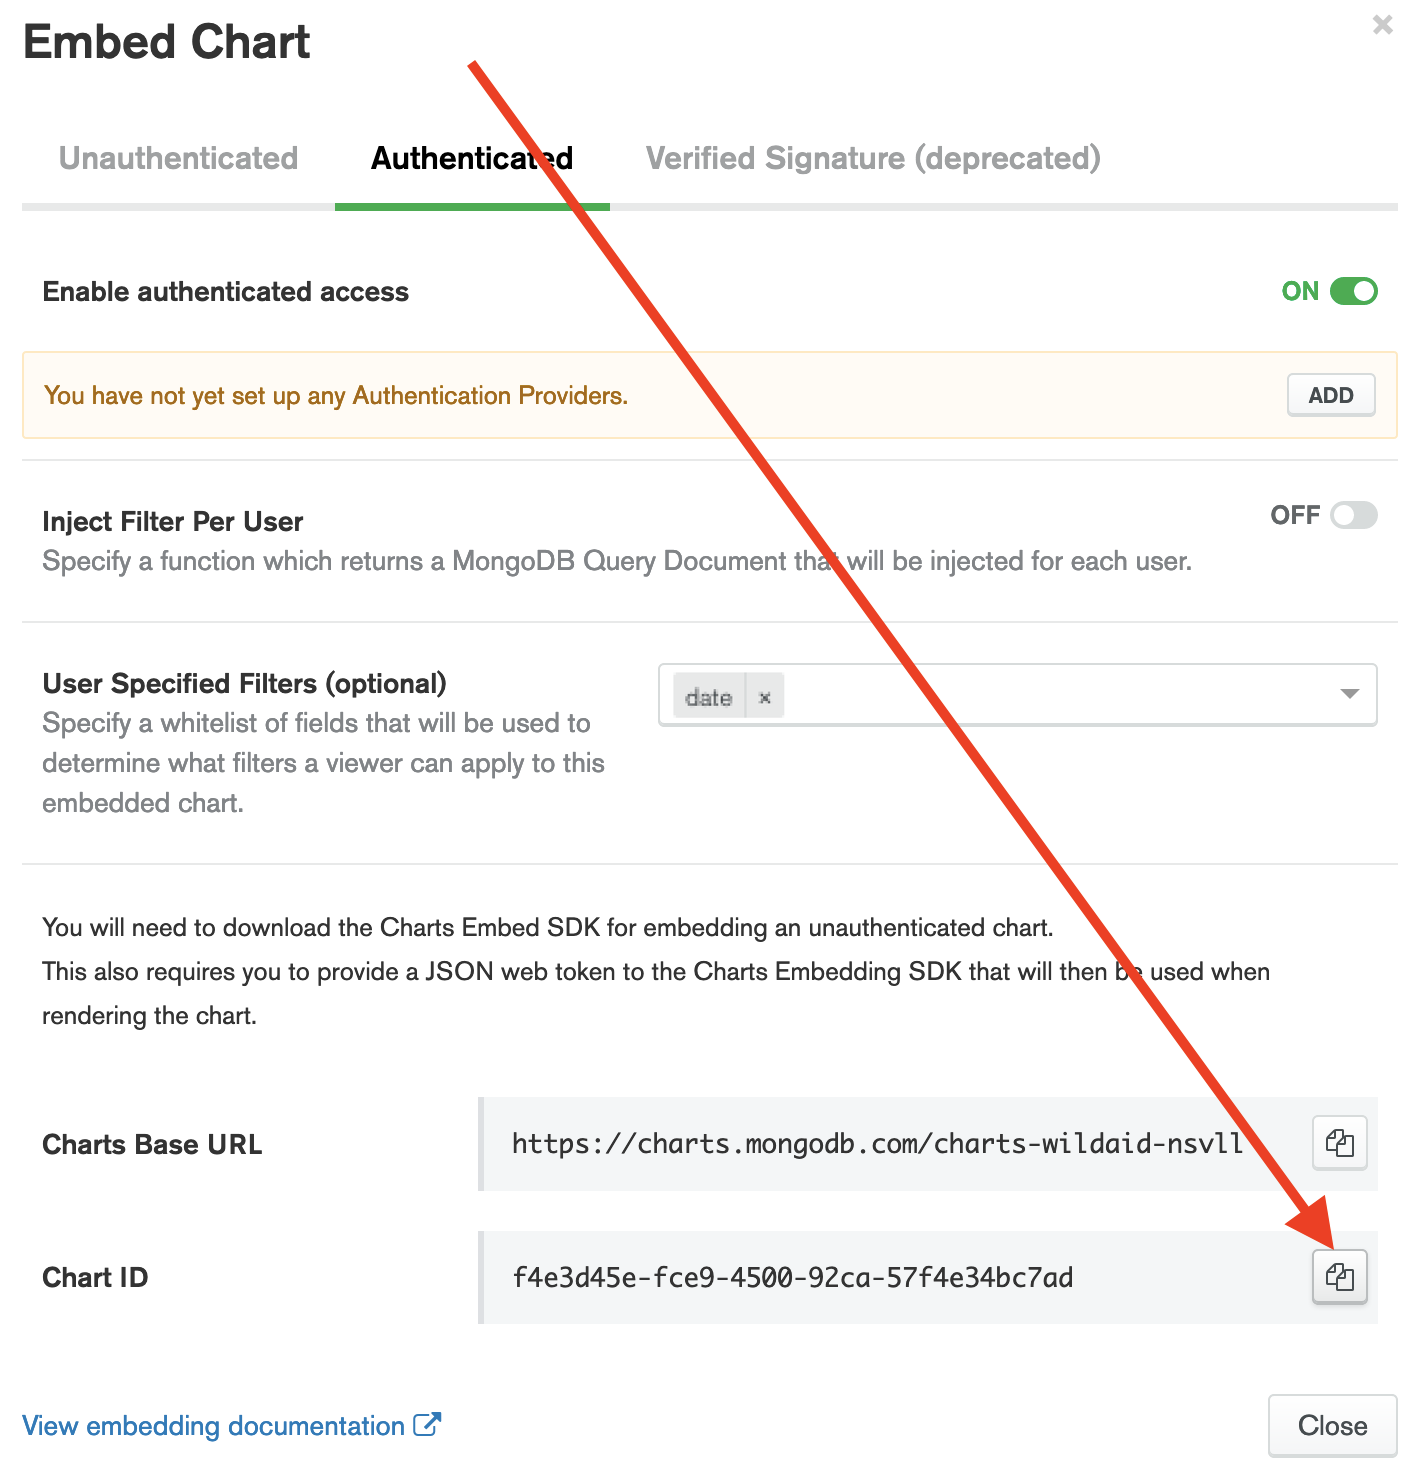
Select the “Authenticated” section, make sure “Enabled authenticated access” is set to “ON”, and set the User Specified Filters to “date” and select the green “SAVE” button:
-
Copy the Chart ID:
-
Select “Close” to close the “Embed Chart” window.
- Paste the Chart ID into your web application’s src/config.js file under “boarding-compliance”.
Finally, the map!