On this page, you will make the map: 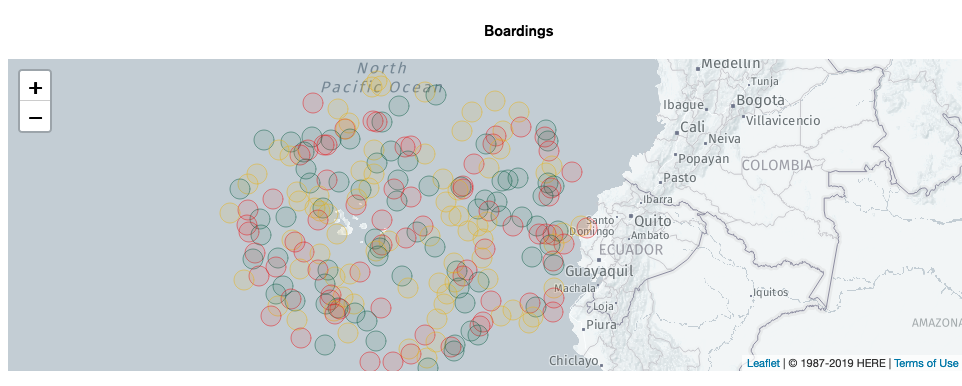
-
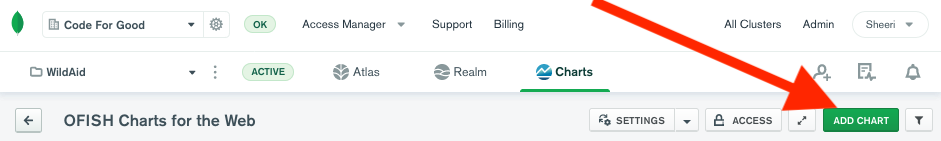
On the Charts Dashboard, select “Add Chart”
-
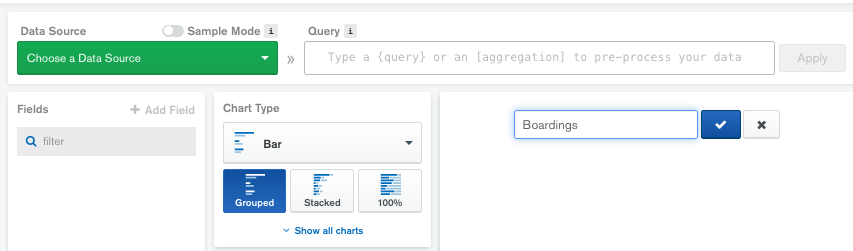
Set the title to “Boardings”
-
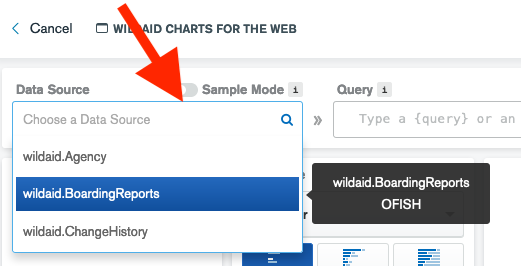
Set the Data Source to wildaid.BoardingReports:
-
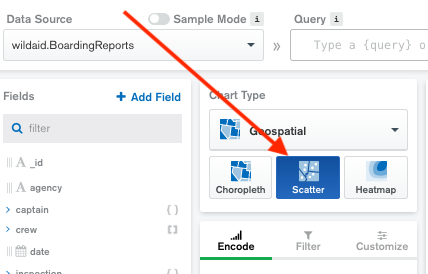
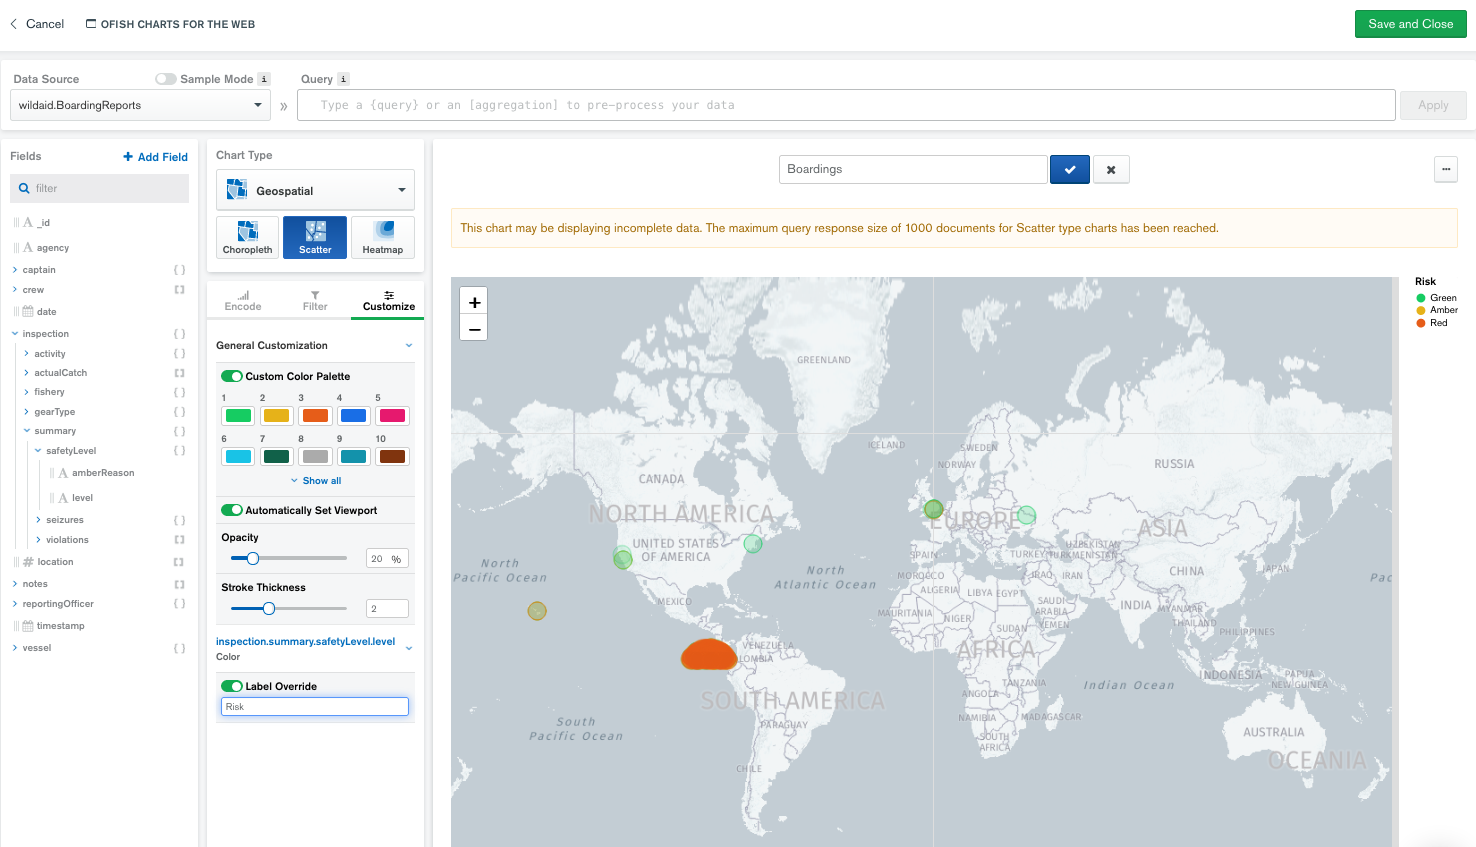
Choose a Chart type of Geospatial:
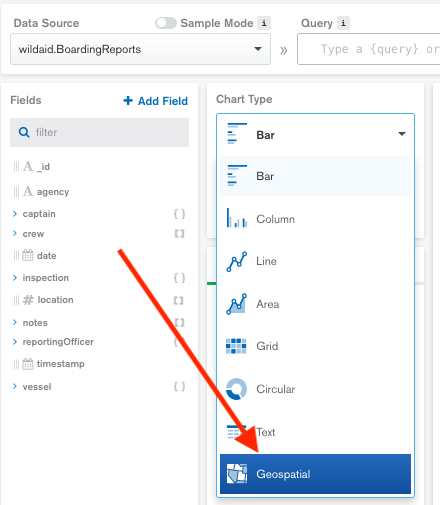
-
Choose a Chart subtype of Scatter:
-
Drag “location” to Coordinates:
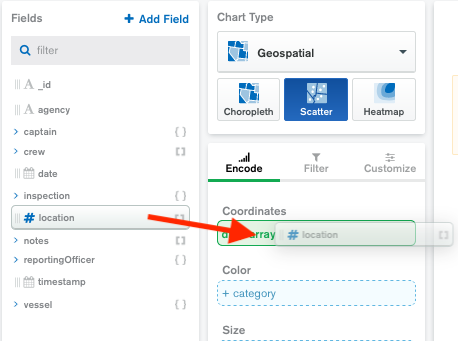
-
Drag inspection -> summary -> safetyLevel -> level to “Color”:
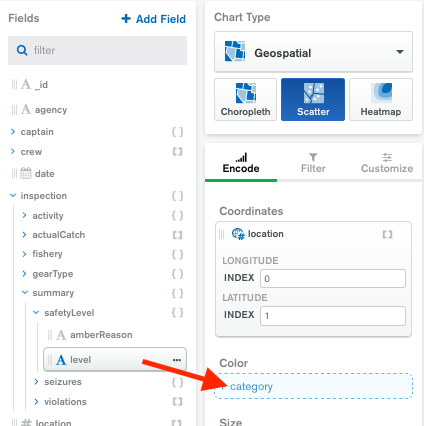
-
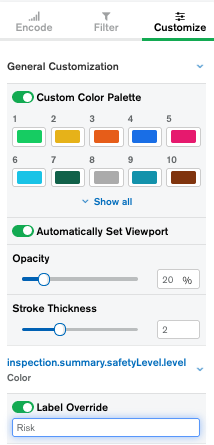
Select “Customize”. Set the Label Override to “Risk” and drag the colors to the proper ordering so that the colors match their labels:
-
Your map looks something like this. Select “Save and Close”:
-
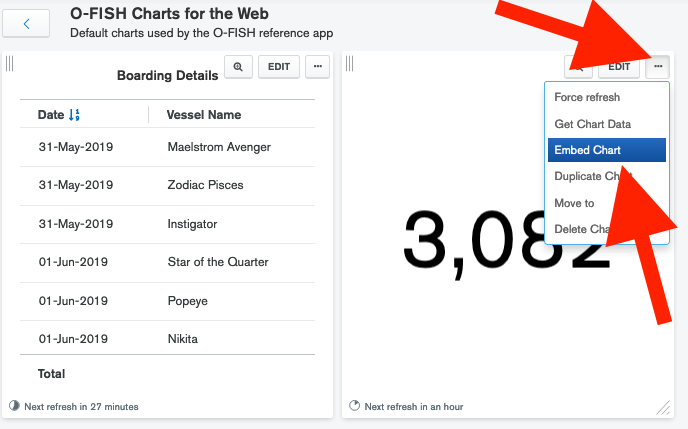
On your dashboard, mouse over the chart until you see the ellipses. Select the ellipses and select “Embed Chart”:
-
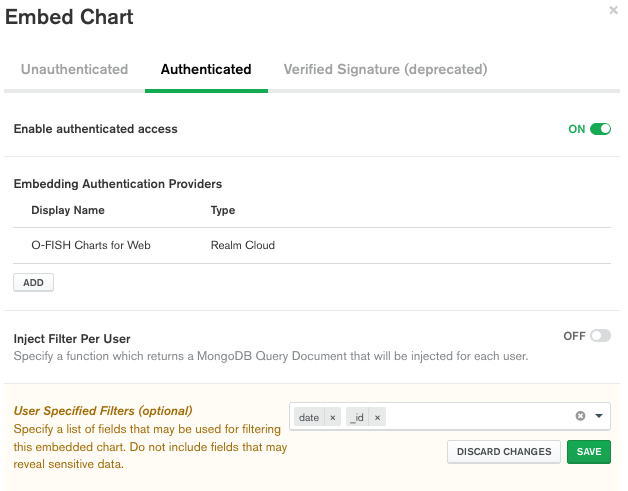
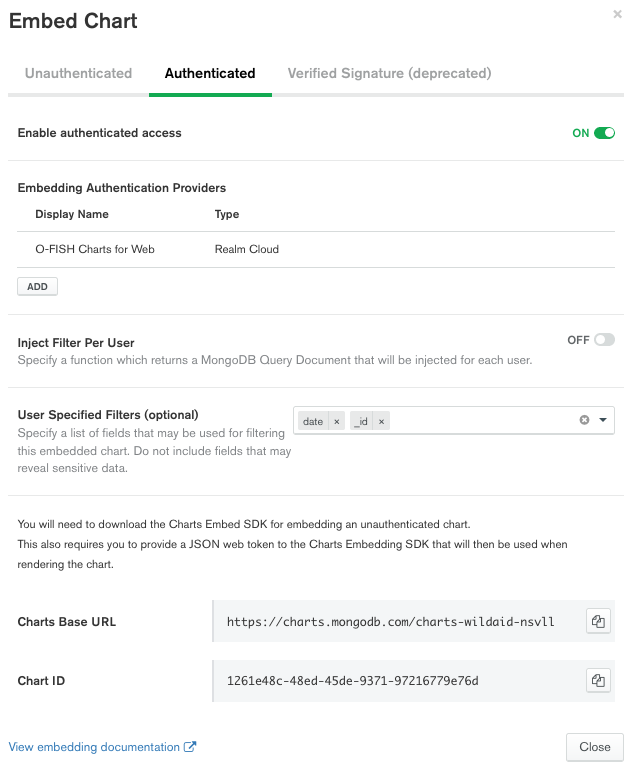
Select the “Authenticated” section, make sure “Enabled authenticated access” is set to “ON”, and set the User Specified Filters to the values: “date” “_id” and select the green “SAVE” button:
-
Copy the Chart ID:
-
Select “Close” to close the “Embed Chart” window.
-
Paste the Chart ID into your web application’s src/config.js file under “boardings”.
That’s it! You’ve created all the charts!