Before we make any charts, we have to set up the data source to use for Charts.
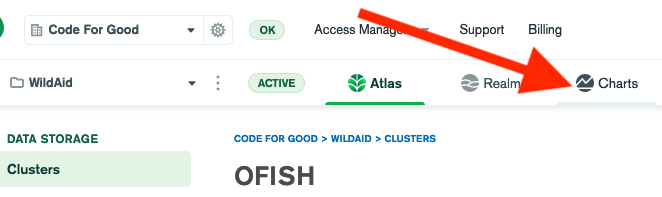
- In the web UI at cloud.mongodb.com, select “Charts” at the top:
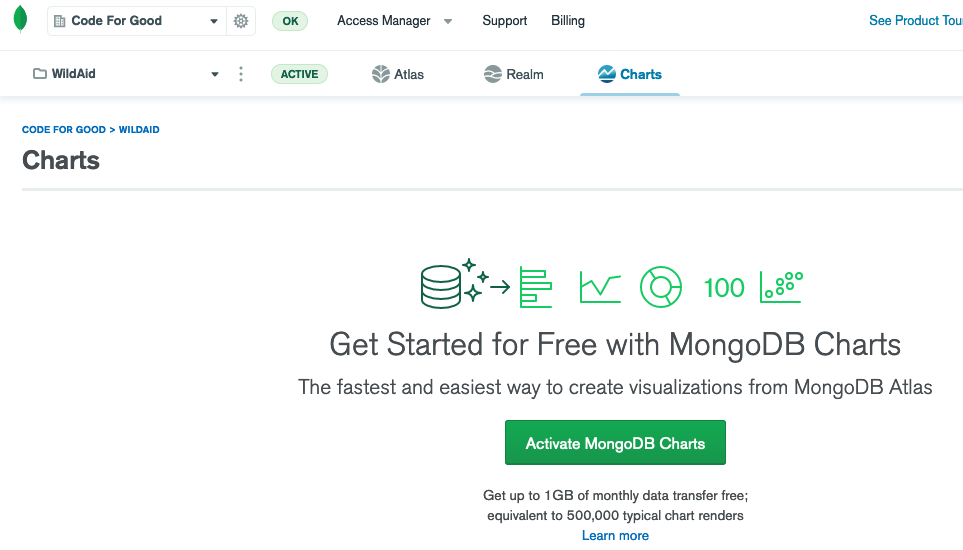
- If you see this screen, select the green button to activate Charts.
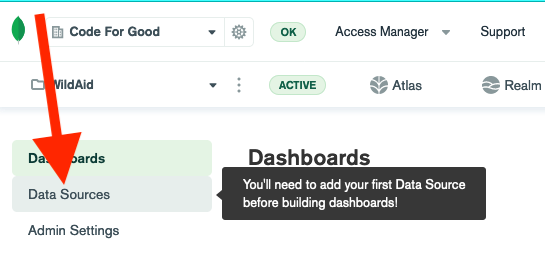
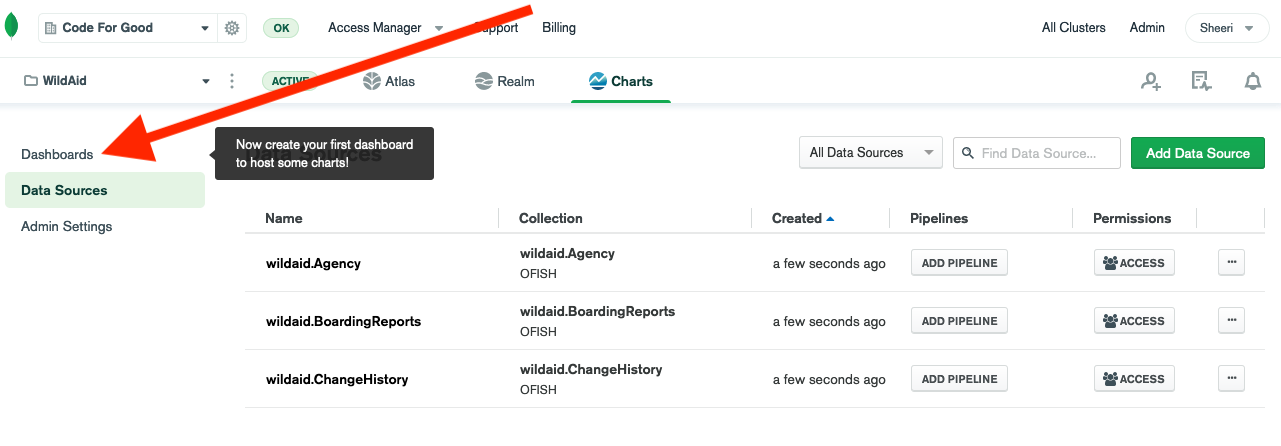
- Select “Data Sources” to add your Atlas database as a source for Charts data:
- Select the green “Add Data Source” button.
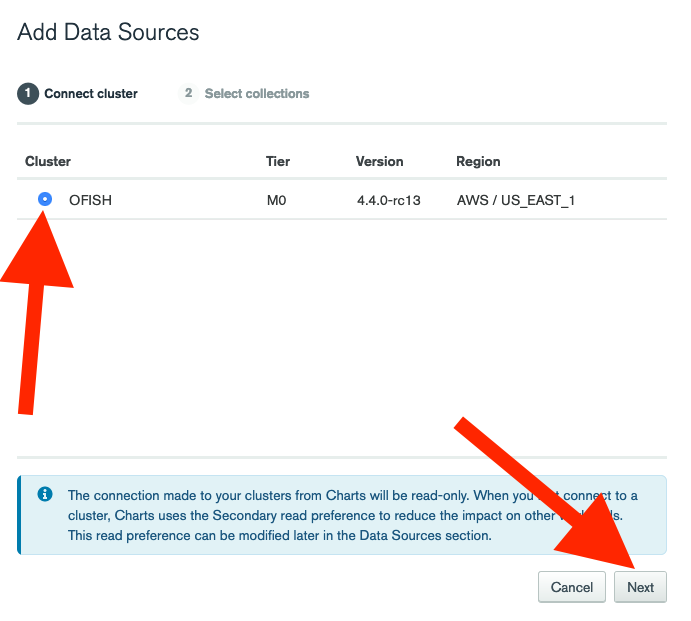
- Choose the Atlas cluster to connect to and select “Next”:
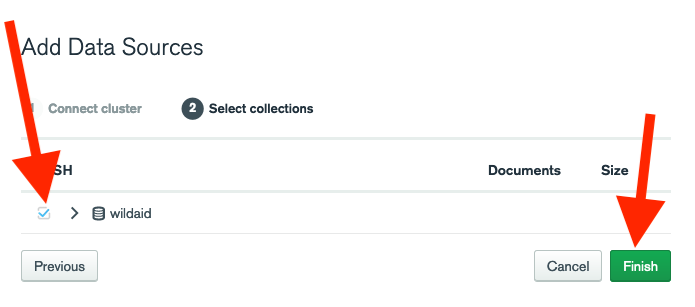
- Select the checkbox next to your database to select all the collections in the database and then select “Finish”:
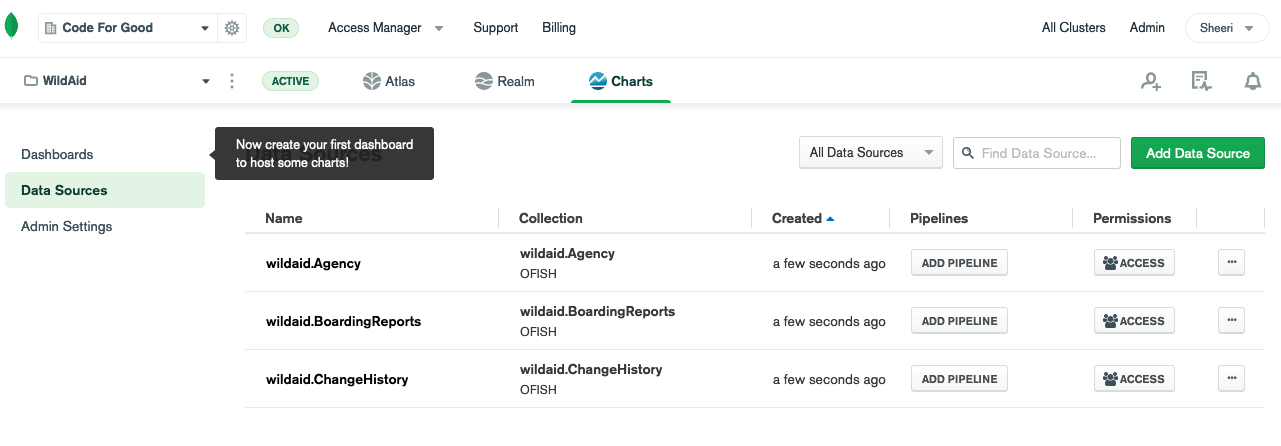
- It has worked when you see data sources added to this screen:
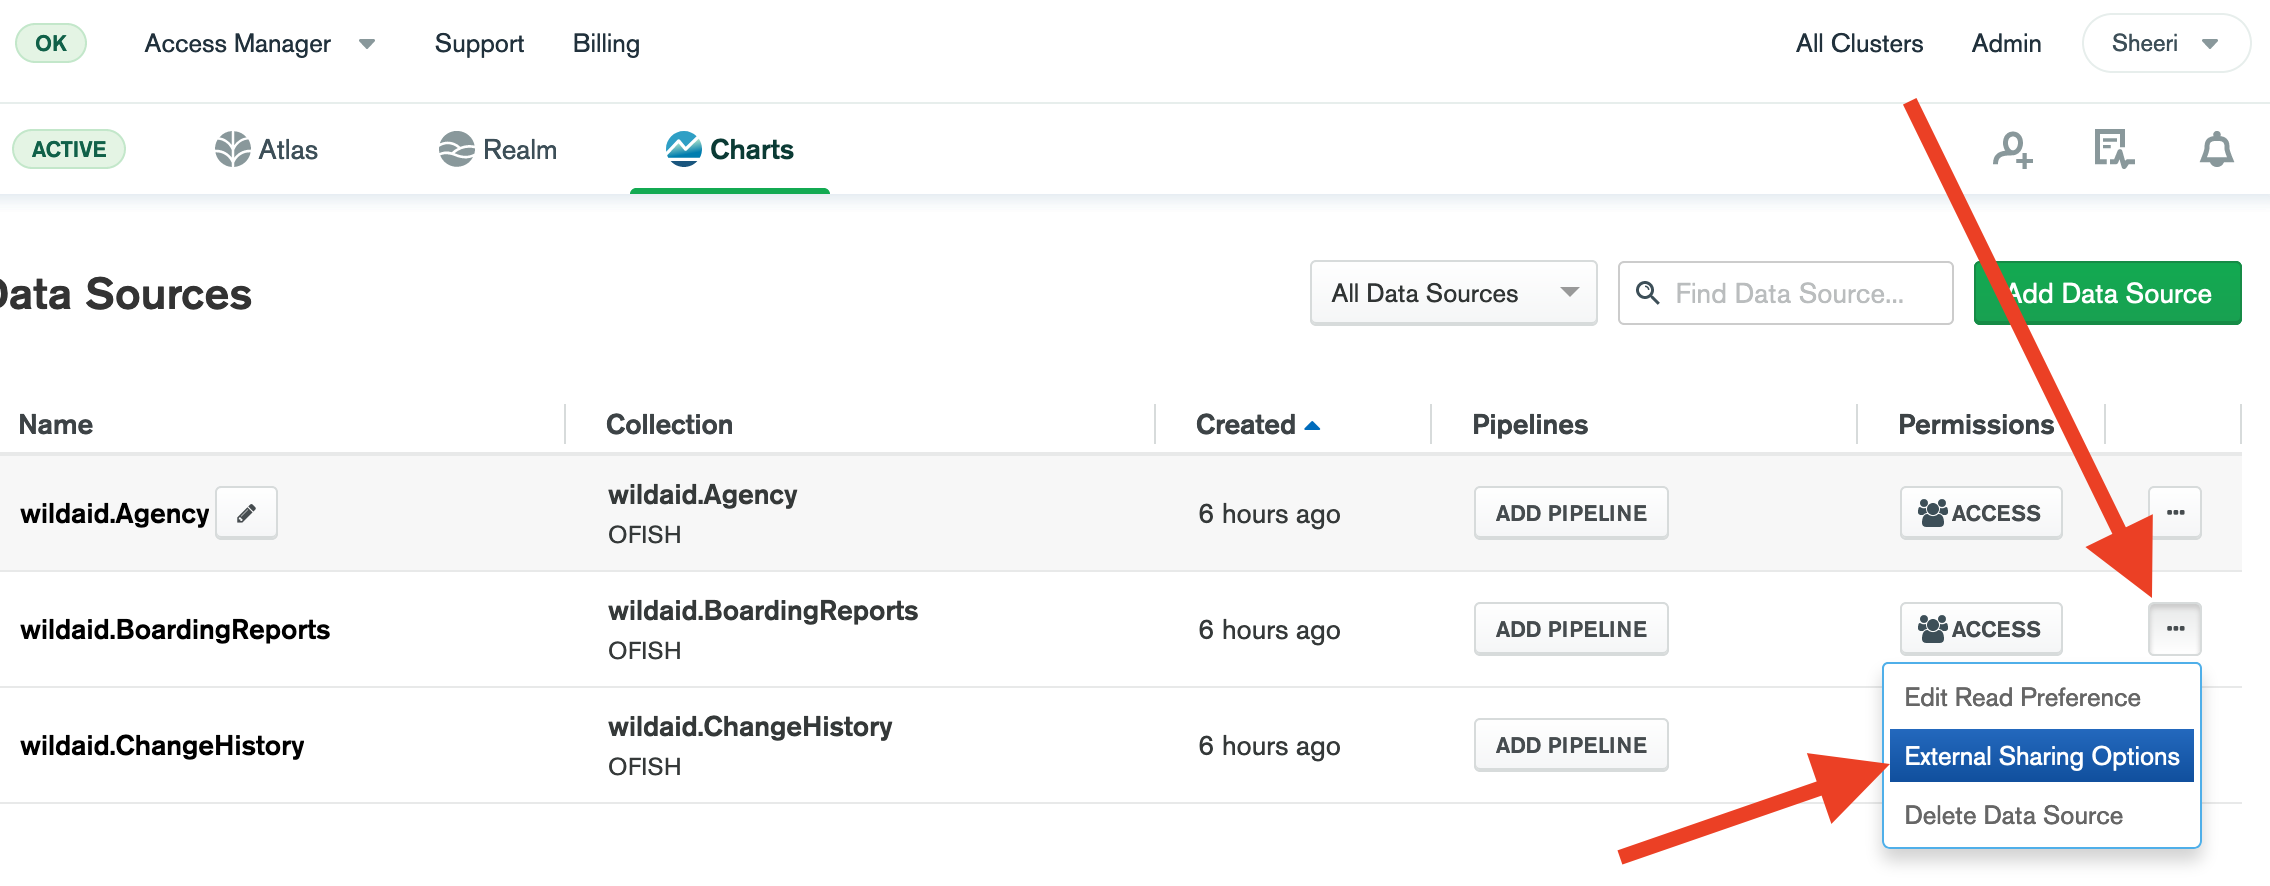
- For the BoardingReports data source, select the ellipses and then “External Sharing Options”:
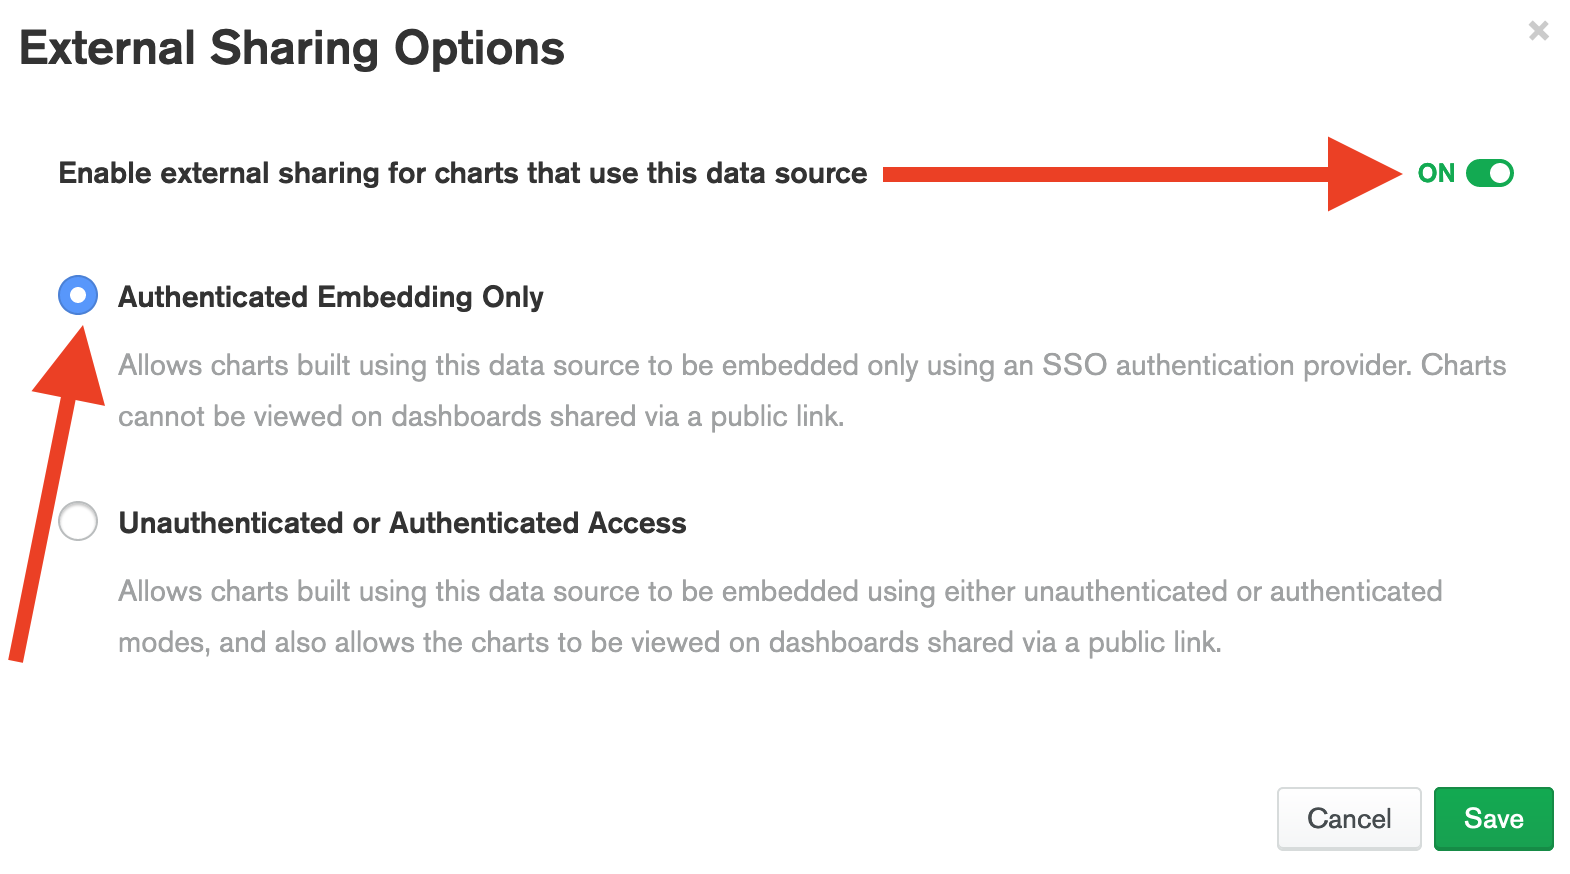
- Set the toggle to “On” to enable external sharing, make sure “Authenticated Embedding Only” is selected, and select the green “Save” button:
- Before we make any charts, we need to create a dashboard to hold the charts. Select “Dashboards”:
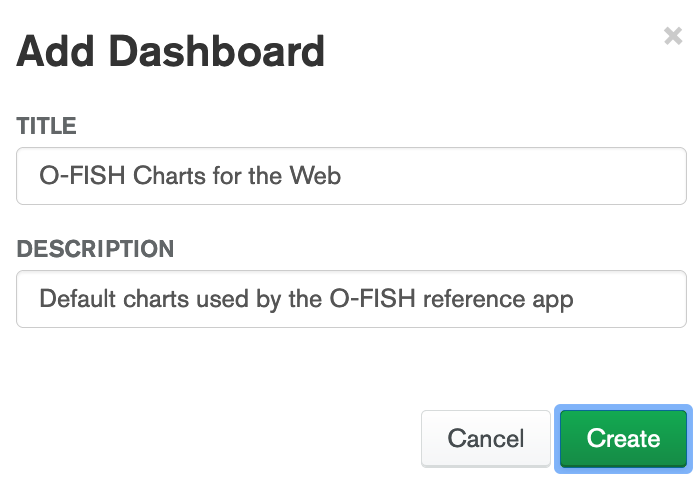
- Select the green “Add Dashboard” button
- Add in a title and description and select “Create”:
- You should now see an empty dashboard, like this:
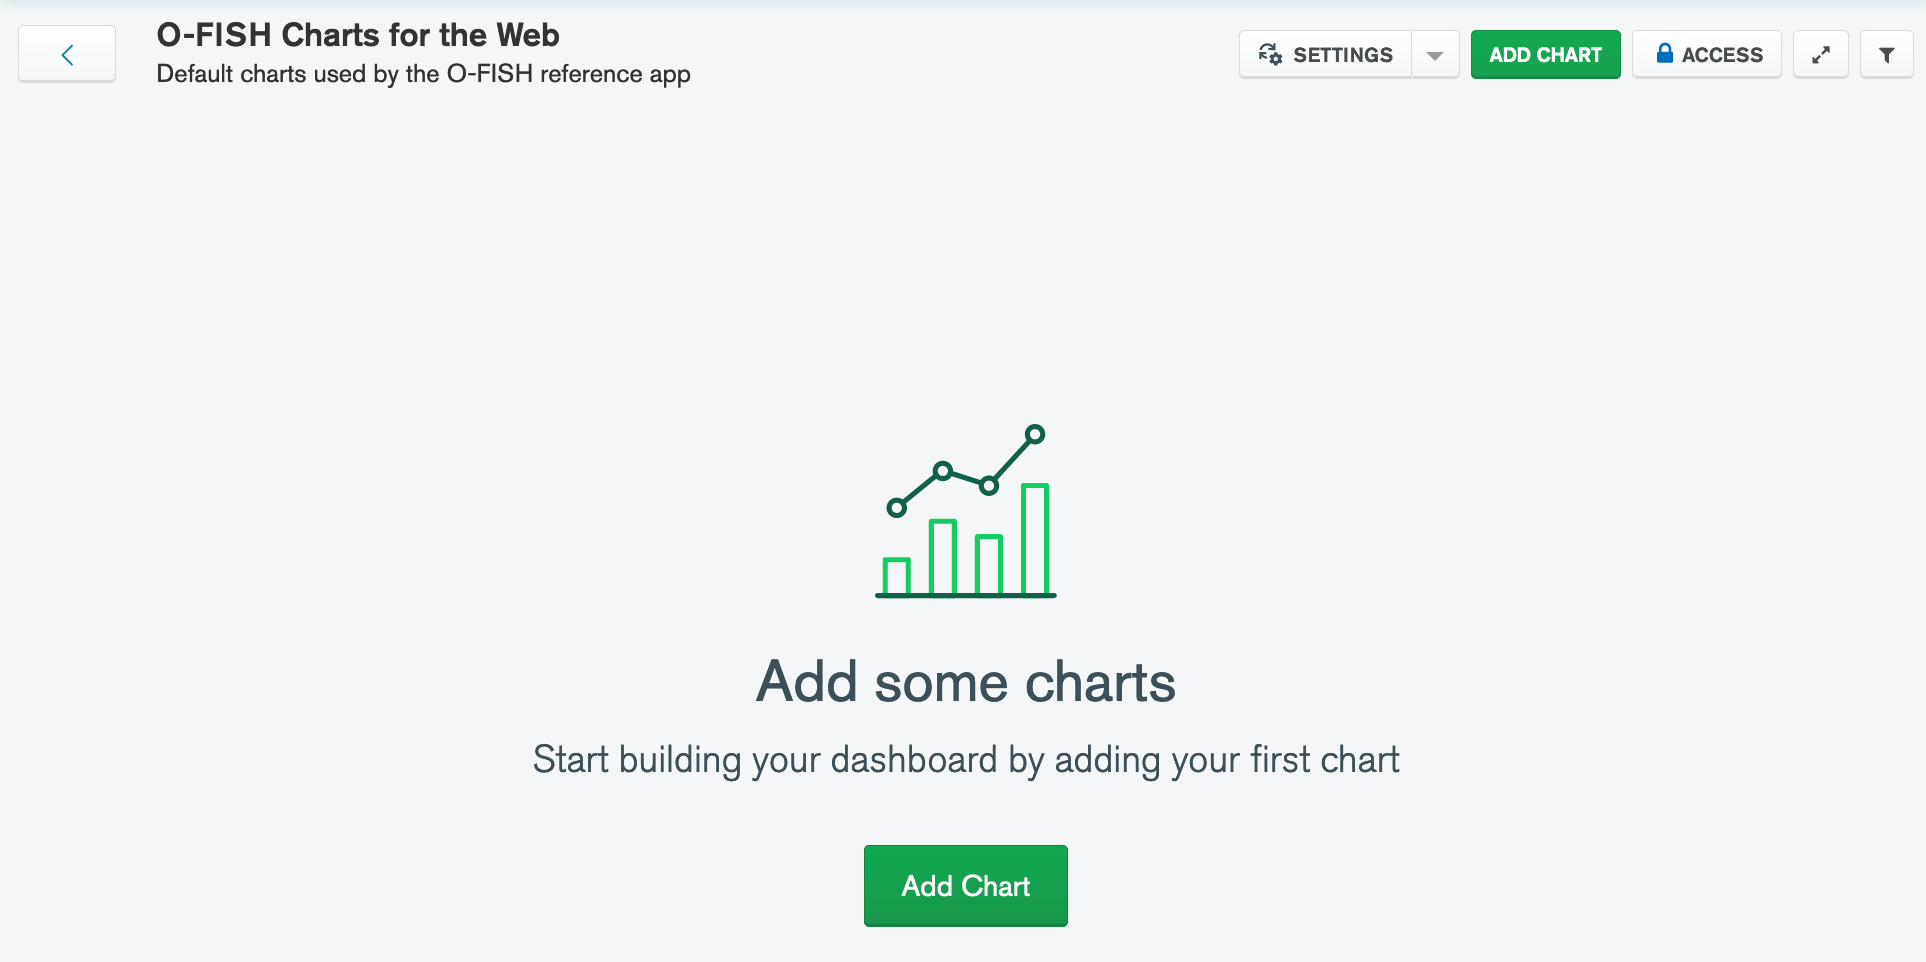
In the next guide we will be making the simplest chart: the list of boardings.