There are 6 charts to make for the O-FISH web app. There are 4 charts in the Compliance Rate section on the homepage - each of the numbers for “Compliance Rate”, “Boardings” and “Violations” are their own charts, plus the donut chart: 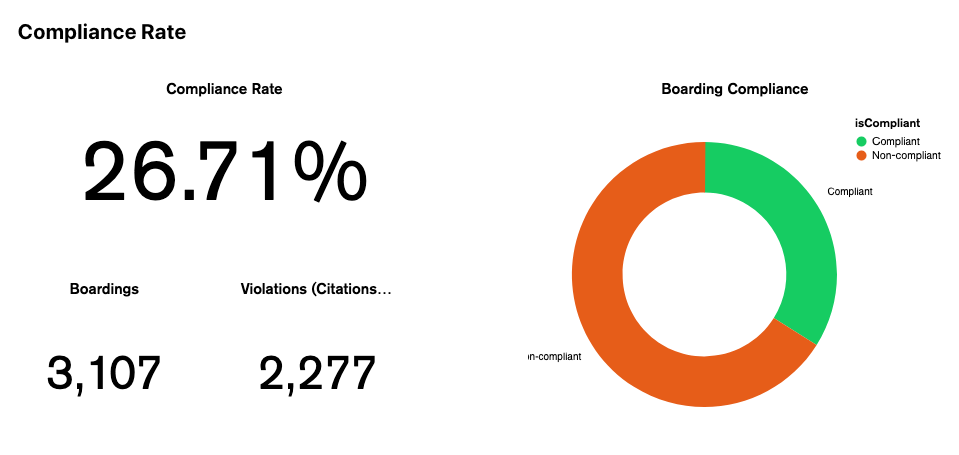
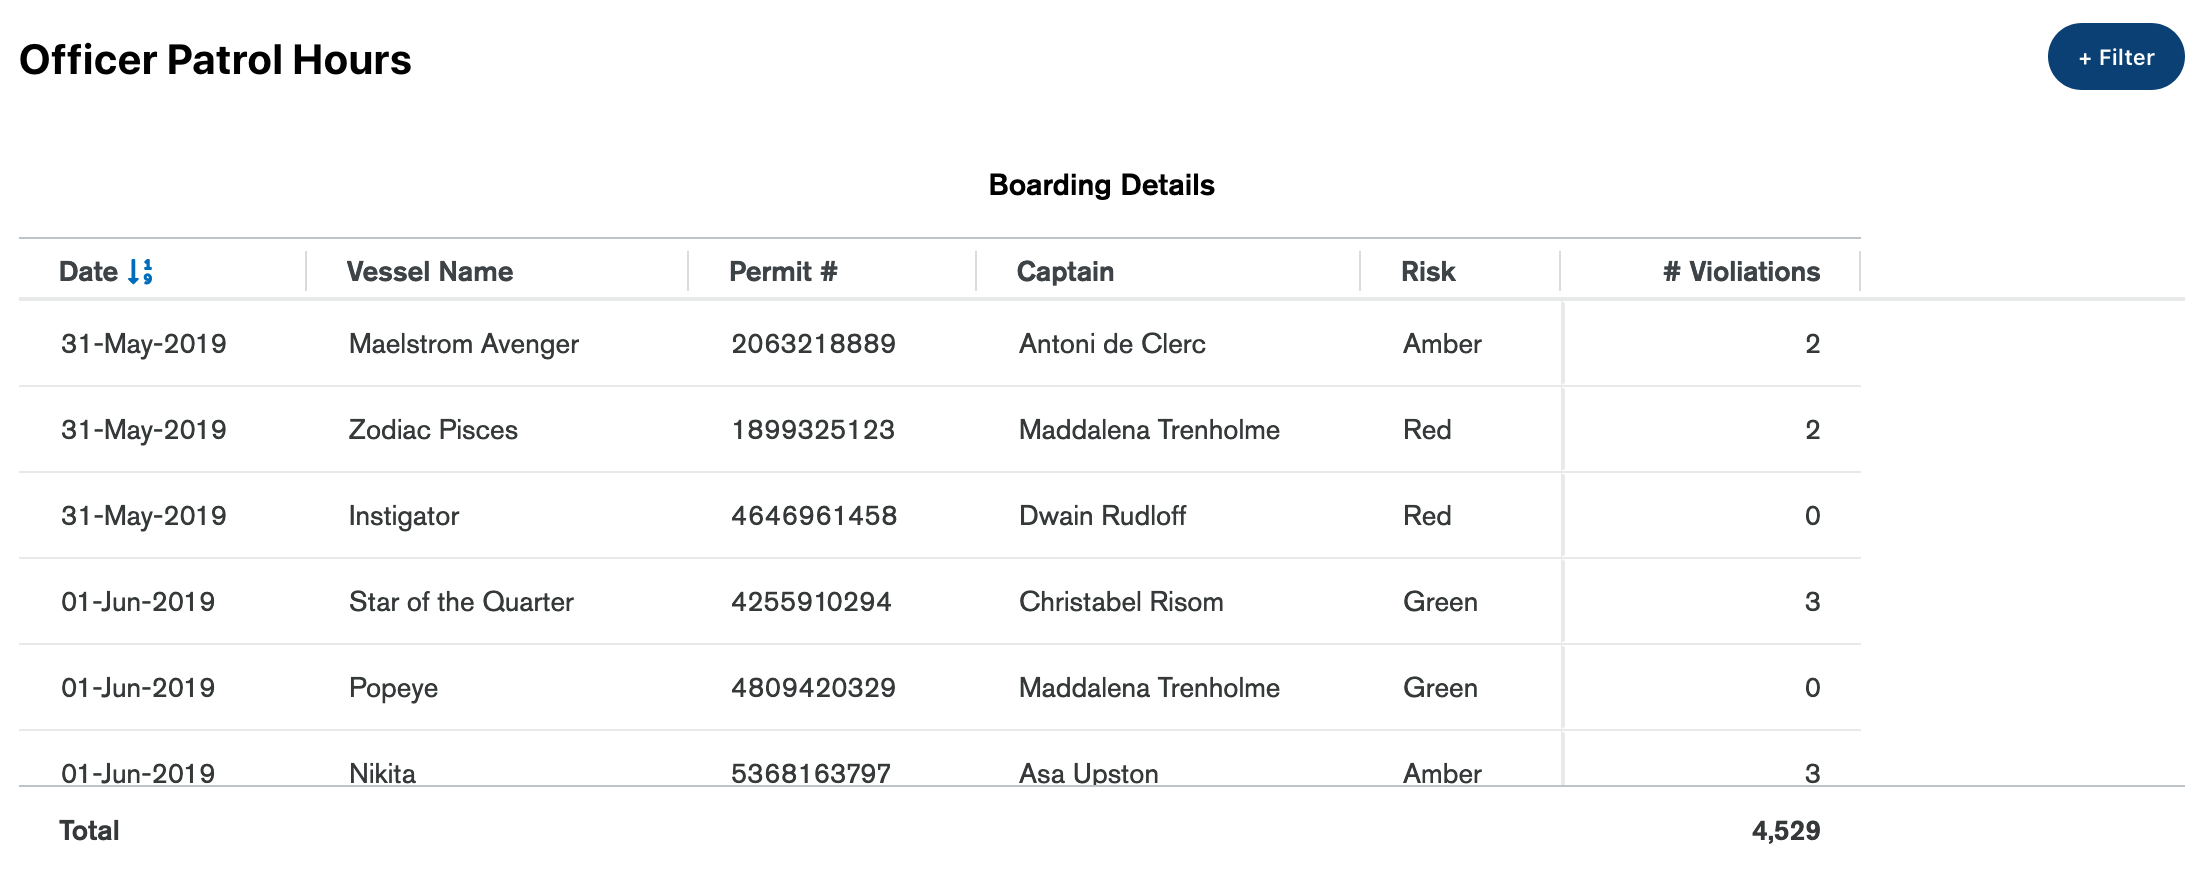
Underneath the Compliance Rate section, there is a map of boardings, and then a chart with a list of boardings: 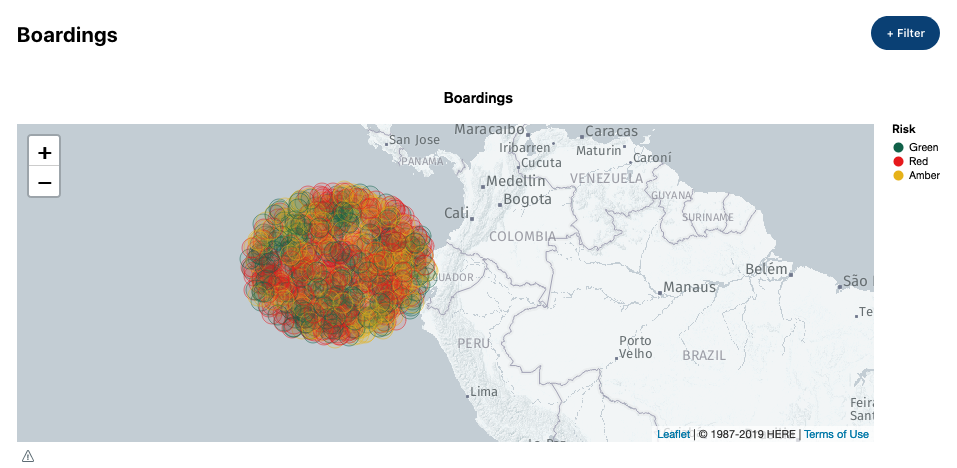
First, we will set up the Data Sources and create a dashboard for our charts.