-
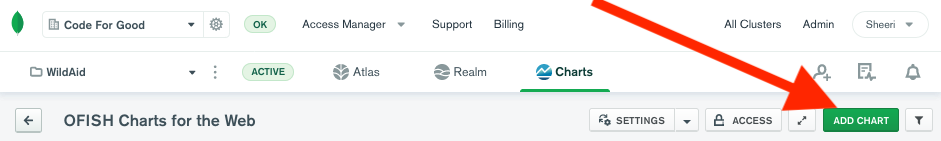
On your dashboard, select the green “Add Chart” button:
-
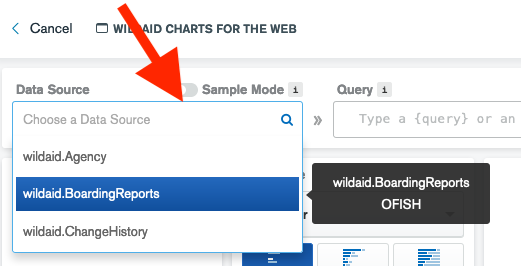
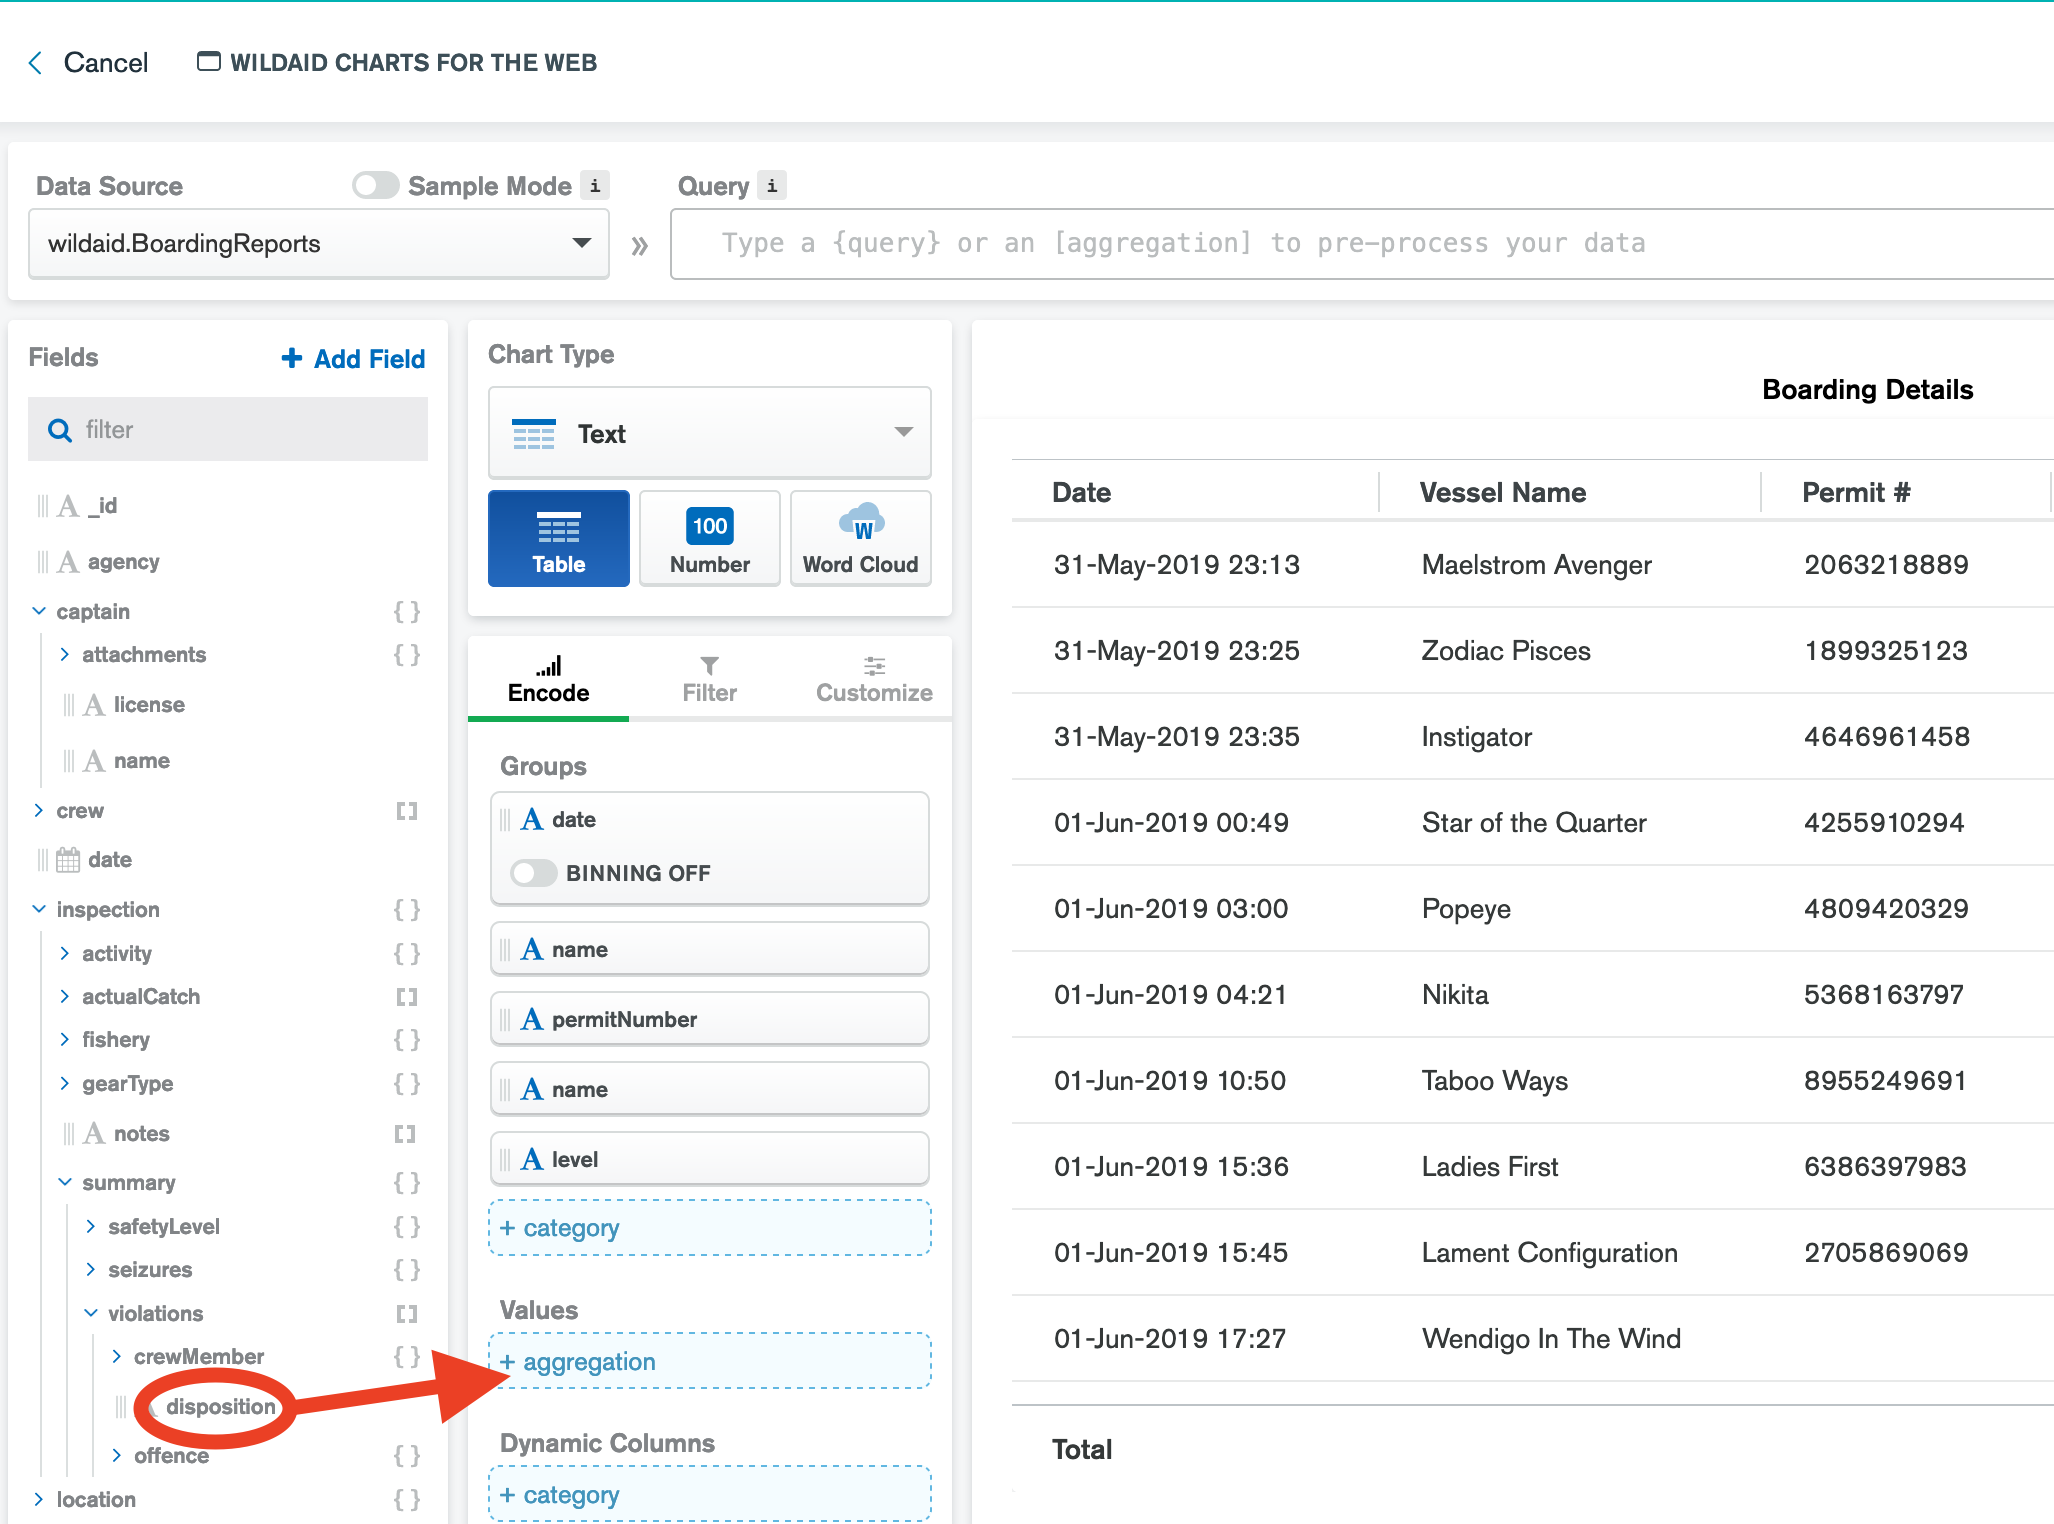
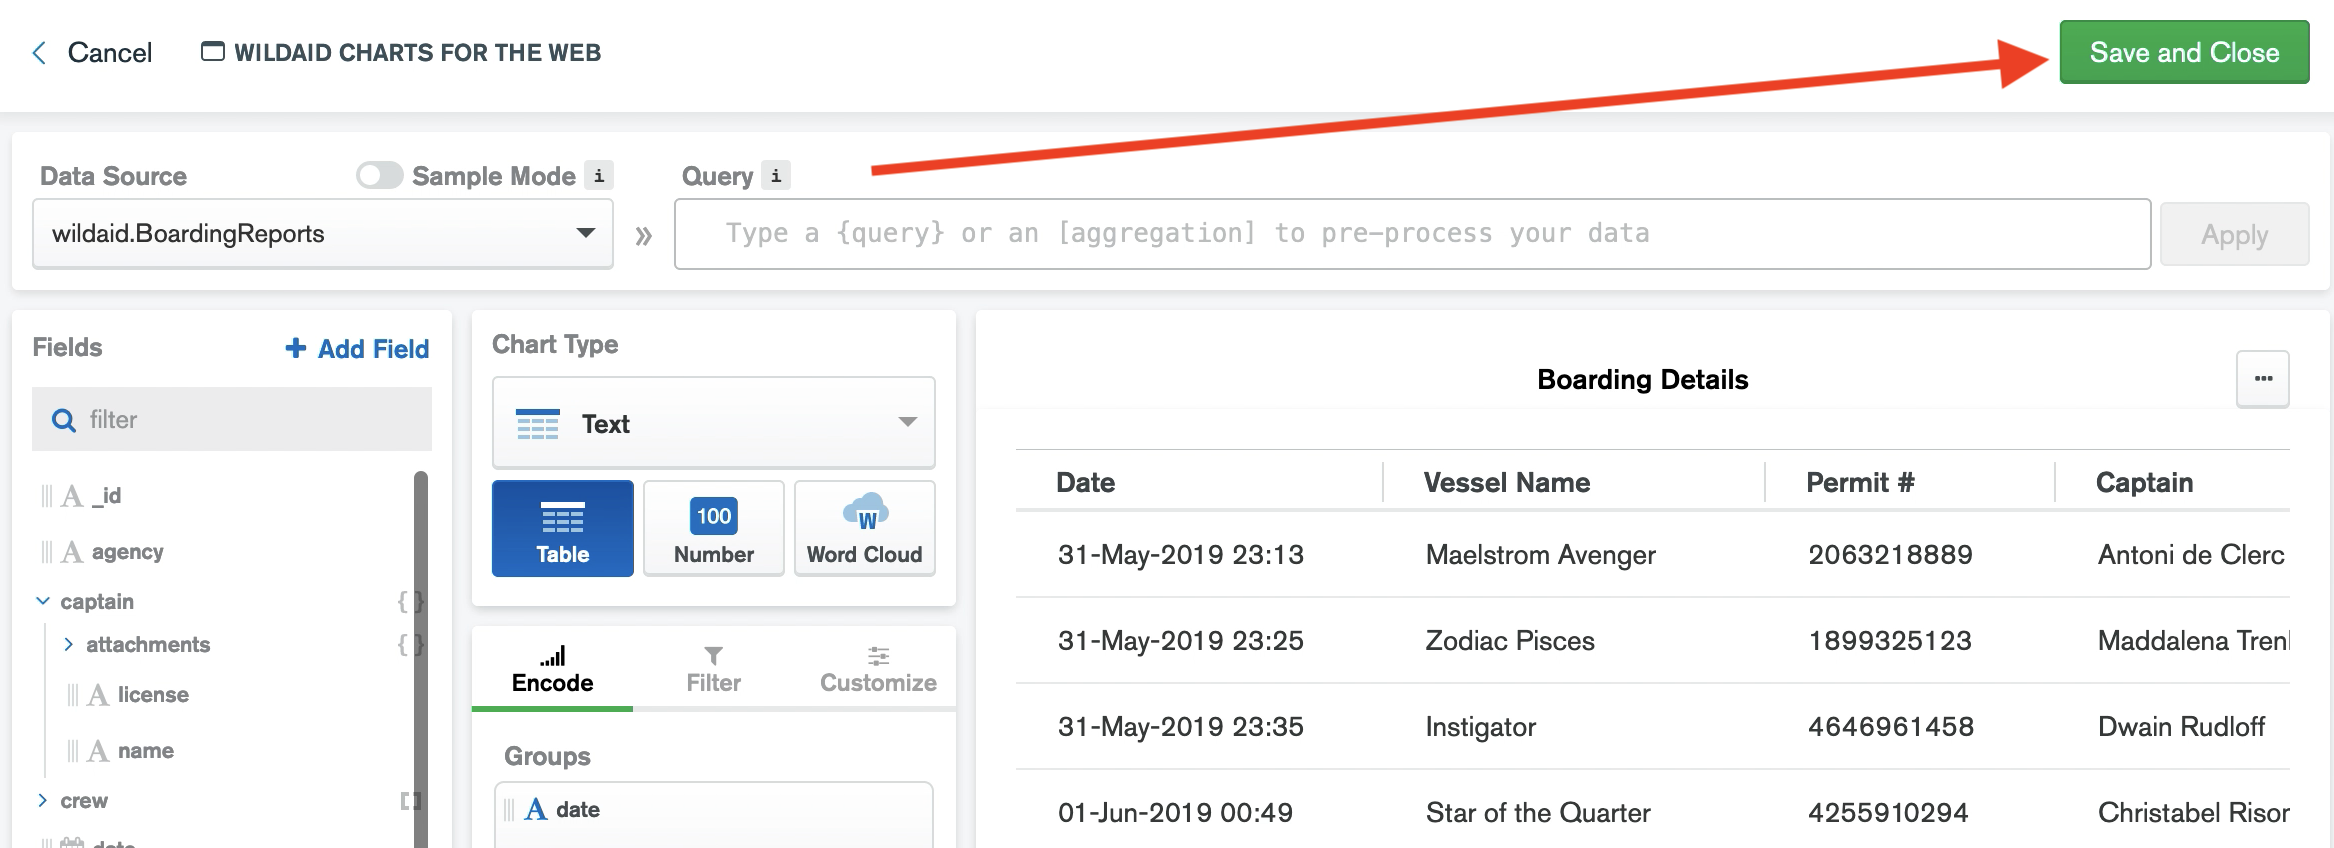
Choose the Data Source of “wildaid.BoardingReports” from the pulldown menu:
-
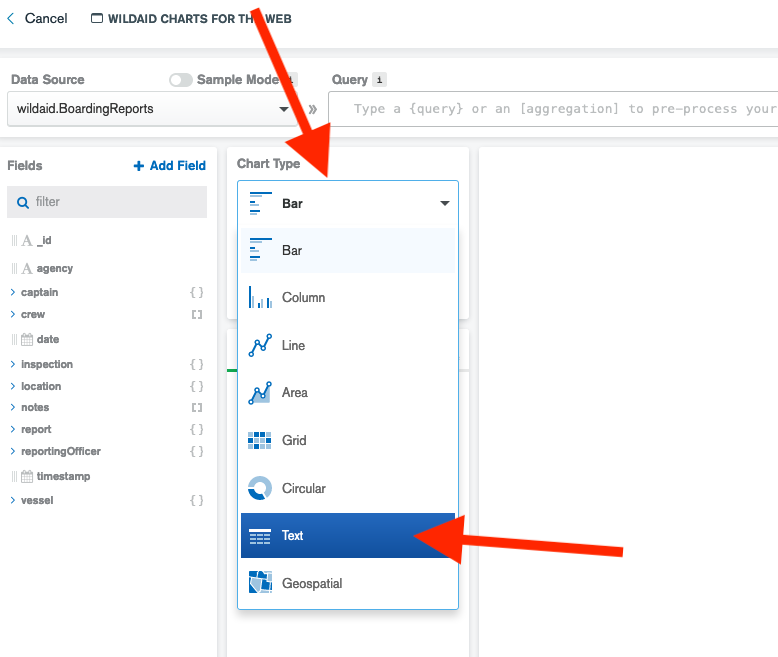
The List of Boardings is a table of boarding details, so choose the “Chart Type” of “Text” from the pulldown menu:
-
Add a title of “Boarding Details” to your chart:
-
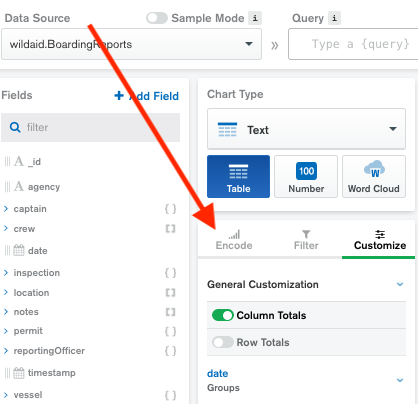
Drag and drop the “date” field to the Groups section, and turn binning off:
-
Customize the date field by selecting on “Customize” and then “date”. Override the label and give it a capitalized first letter - “Date” - and add in the time - you can choose any format, this gif chooses “15:23”:
-
Select “Encode” to go back to the encoding section:
-
Drag the following fields to “Groups”:
vessel -> name
vessel -> permitNumber
captain -> name
inspection -> summary -> safetyLevel -> level
-
Select “Customize” and “Label Override” to change the label name for the fields you added in the previous step:
vessel.name - Vessel Name
vessel.permitNumber - Permit #
captain.name - Captain
inspection.summary.safetyLevel.level - Risk
This is what the headings should look like when this step is done: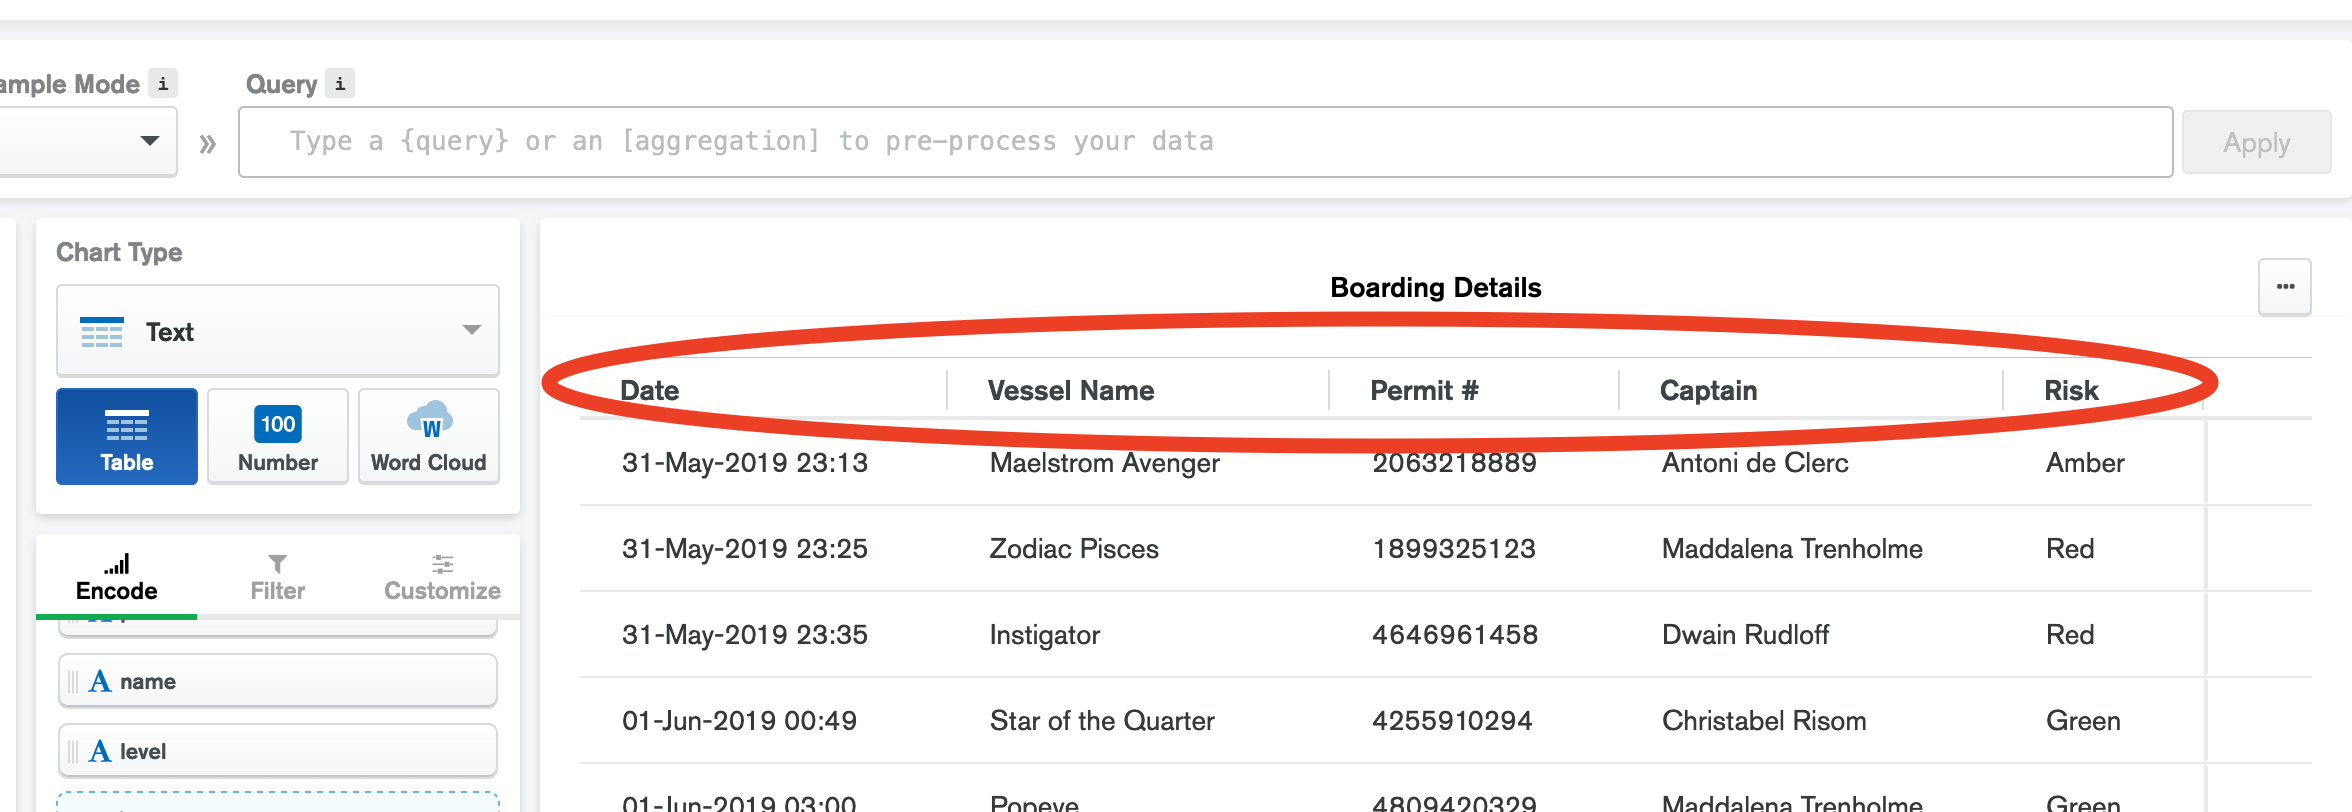
-
Select “Encode” and drag to the “Values” section the field: inspection -> summary -> violations -> disposition
-
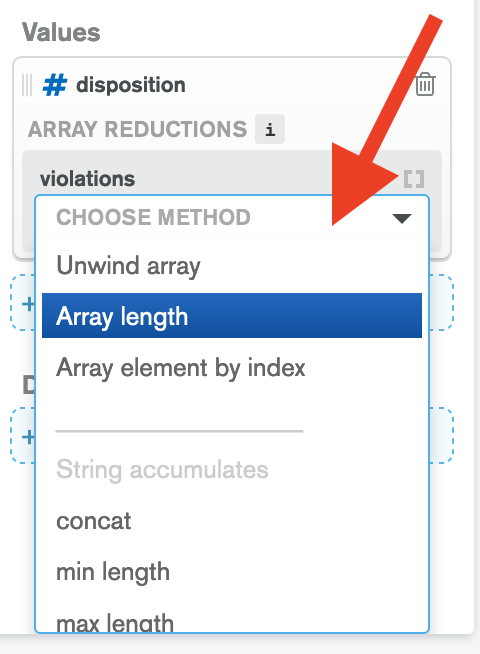
Choose the Array Reduction by “Array Length”:
-
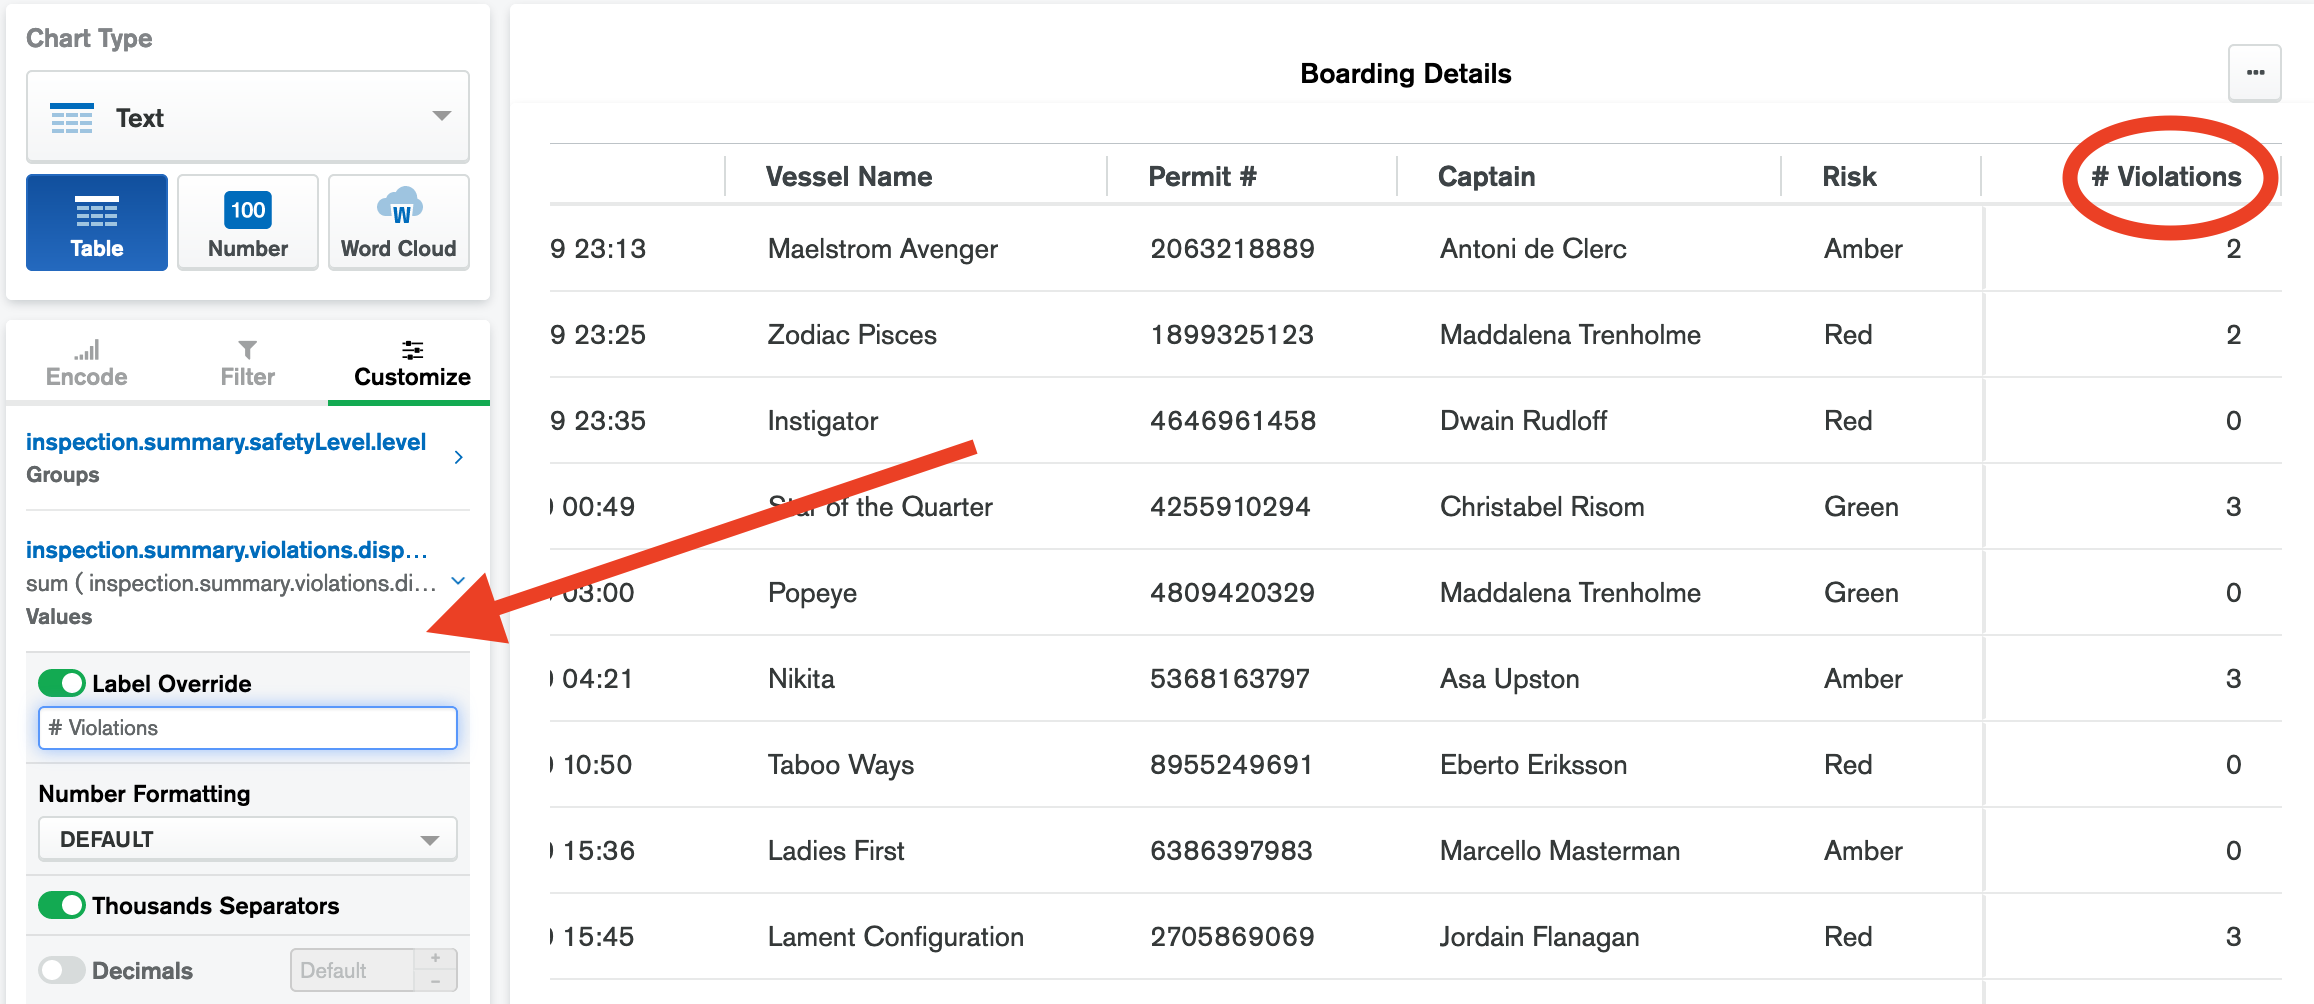
Go to the “Customize” section and override the Label to say “# Violations”:
-
Select the “Save and Close” button
Congrats! You have made your chart!